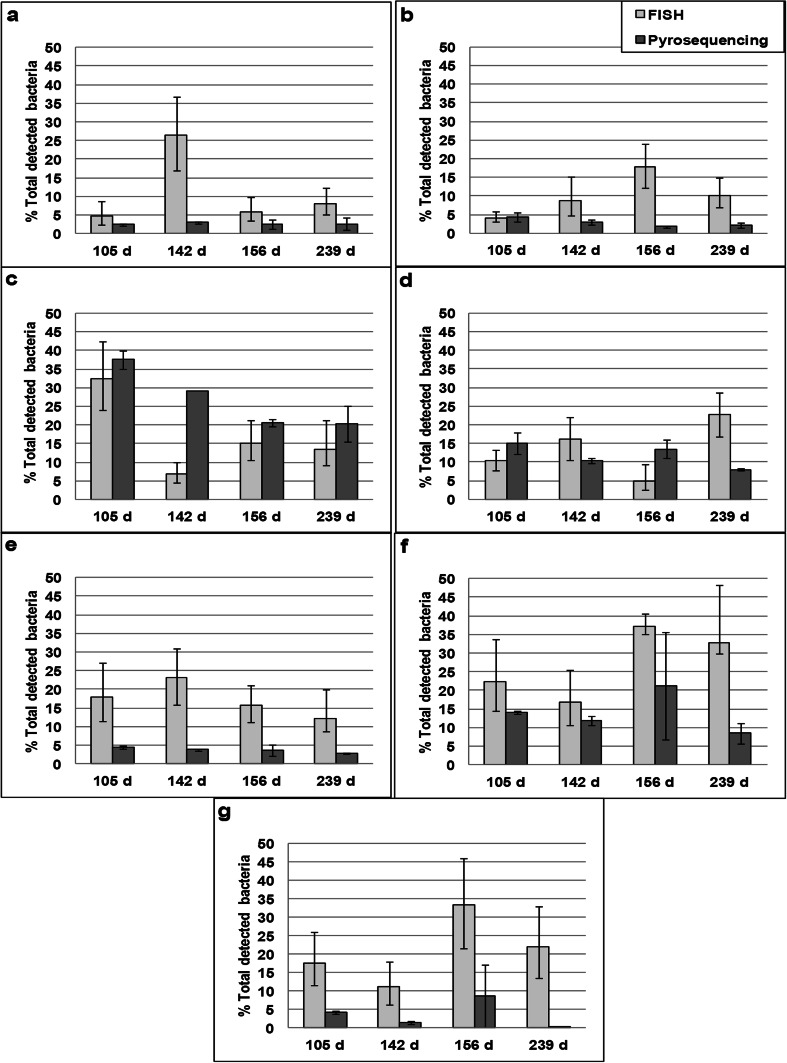
Fig. 6.
Percentages of total bacteria detected by FISH and pyrosequencing for the taxonomic groups a Actinobacteria, b Firmicutes, c Alphaproteobacteria, d Betaproteobacteria, e Deltaproteobacteria, f Gammaproteobacteria, and g Pseudomonas. Percentages for pyrosequencing represent the fractions of total sequence tags that could be assigned to a specific taxonomic classification. Error bars represent the lower and upper values of individual replicates for each sampling time. Percentages for FISH represent the fractions of total fluorescence obtained by general eubacterial probes combined with specific phyla, class, or genera probes. Error bars in the FISH data represent the upper and lower bounds of error calculated from the image analysis process. All FISH data originally comes from Pérez et al. (2014)

