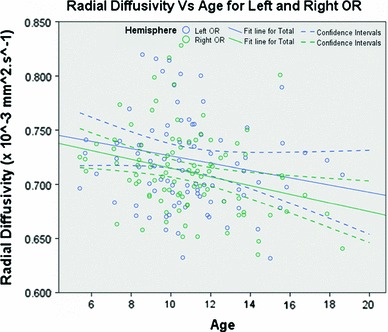
Fig. 10.

Radial diffusivity as a function of age in the left and right OR. Values for the left OR are shown in blue and values for the right OR in green. Linear regressions are displayed as solid lines, while their associated confidence intervals are demarcated with dashed lines
