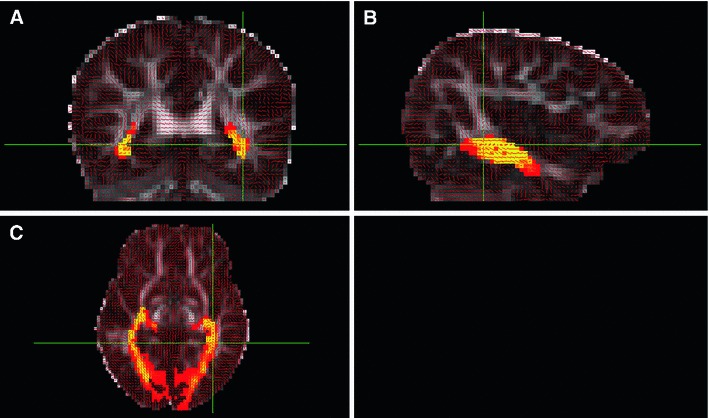
Fig. 6.

Example of probabilistic map of the OR to which is applied a PICo threshold of 1 % represented in a coronal (a), sagittal (b) and axial (c) plane. The OR reconstruction is displayed in a linear hot colour scale ranging from just above 0 (red) to 1 (yellow). The background FA map is shown in greyscale and the main diffusion directions in each voxel are shown as small red segments
