
Fig. 7.
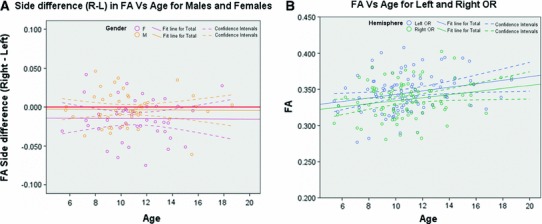
Changes with age of FA side difference variable (FA Right–FA left) (a) and FA (b). a The FA side difference variable is shown in purple for females and in orange for males. The value corresponding to no difference between left and right hemisphere is represented by a bold red horizontal line. b FA values of the left OR are shown in blue and for the right OR in green. a, b Linear regressions are displayed as solid lines, while their associated confidence intervals are demarcated with dashed lines