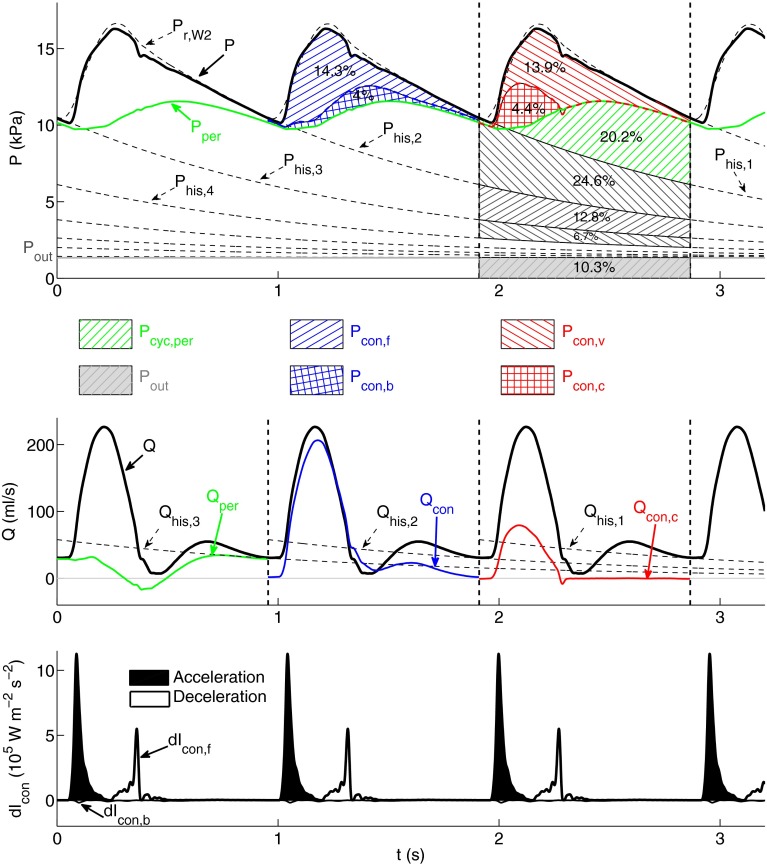
Figure 4.
Analysis of the pressure ( top) and flow ( middle) waveforms in the midpoint of the thoracic aorta of the ‘healthy’ model using the new methodology described in “Combined Pulse Wave Analysis” section. and in the cardiac cycles bounded by dashed vertical lines are separated into different types of physical contributions. (top) Contributions to from forward- () and backward-traveling () conduit wavefronts (blue hatched area), vascular () and cardiac () conduit wavefronts (red hatched area), peripheral wavefronts originating within the current cardiac cycle ( green hatched area), wavefronts originating within the three previous cardiac cycles which are calculated from the history pressures and (black hatched areas), and the outflow pressure (gray area). is the peripheral pressure. Contributions are quantified as a percentage of the total area under the pressure waveform. (middle) Peripheral (), conduit (), cardiac conduit (), and history () flow waveforms. (bottom) Forward () and backward () components of conduit wave intensity (d). Shaded waves (black) accelerate blood flow and non-shaded waves (white) decelerate blood flow

