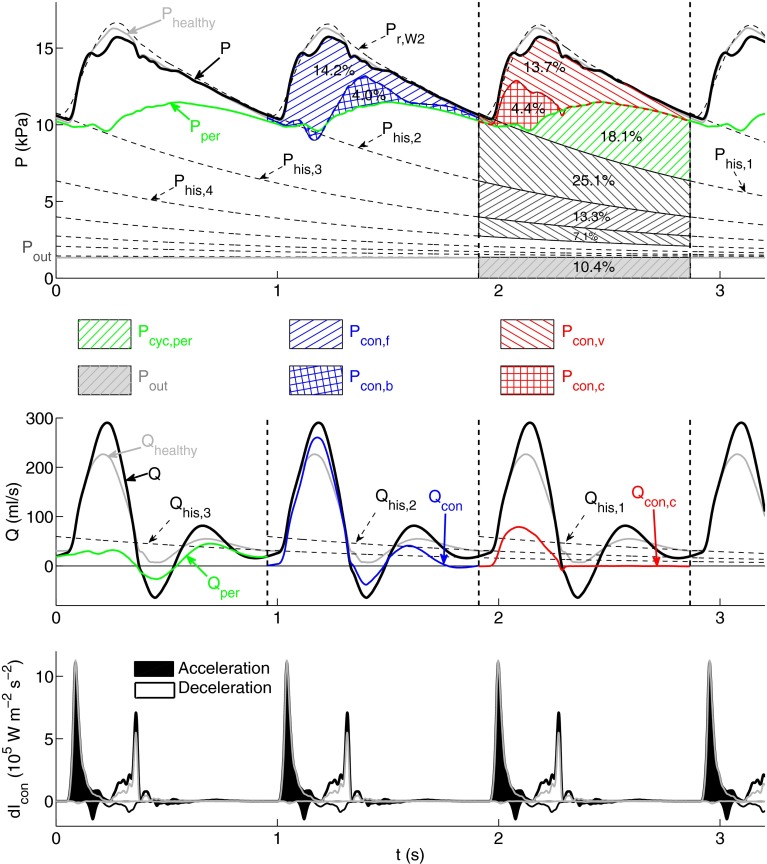
Figure 6.
Analysis of the pressure ( top), flow ( middle) and conduit wave intensity (d bottom) waveforms in the midpoint of the thoracic aorta of the model with an abdominal aortic aneurysm using the same format and methodology as described in Fig. 4. The corresponding total pressure (), flow () and conduit wave intensity waveforms for the ‘healthy’ model are superimposed in gray

