Figure 4.
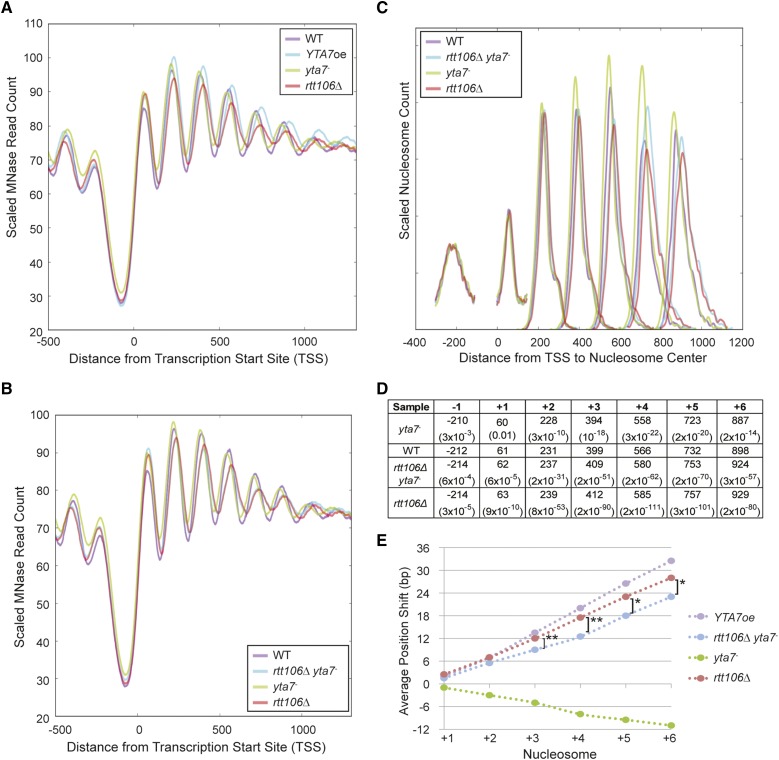
Loss of Rtt106 increased nucleosome spacing. (A) The distribution of MNase-Seq read count relative to the TSS for wild type (WT), cells overexpressing Yta7 (YTA7oe), cells not expressing Yta7 (yta7-), and cells lacking Rtt106 (rtt106Δ). YTA7oe and rtt106Δ cells exhibited a 3′-shift in nucleosome position relative to wild type. (B) The distribution of MNase-Seq read count relative to the TSS for wild type (WT), cells not expressing Rtt106 or Yta7 (rtt106Δ yta7-), cells not expressing Yta7 (yta7-), and cells lacking Rtt106 (rtt106Δ). (C) The distribution of nucleosome centers relative to the TSS for called nucleosomes. MNase-seq data depicted in B were used to identify nucleosome centers, and the distance of each nucleosome center from the TSS was plotted. Distances were smoothed with a Hanning window. The relative nucleosome count was normalized per position (Table S2). (D) Average distance of the indicated nucleosome’s center to the TSS and the associated P-value (two-tailed t-test) compared to wild type. Samples are listed in 5′–3′ order of mean nucleosome position. (E) The average shift for the indicated nucleosomes in mutant compared to media-matched wild-type samples (YPD for yta7- and YPGal for YTA7oe). Nucleosome centers were identified as in D but for two biological replicates per strain. Upstream and downstream are indicated by negative and positive, respectively. Astericks indicate called nucleosome position means significantly distinct between rtt106Δ and rtt106Δ yta7-. *P < 0.001; **P < 10−6 (two-tailed t-test).

