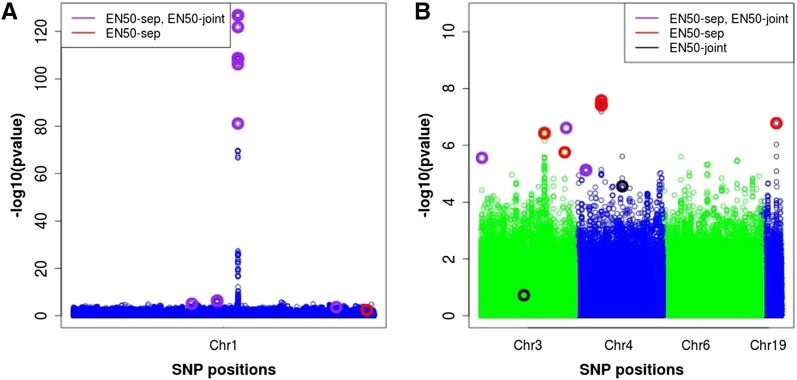
Figure 10.
Plot of −log10(P-value) for SNPs on chromosomes 1 (left), 3, 4, 6, and 19 (right) for the real data. EN50-sep (EN50-joint) denotes the elastic net with 50% weight on L1 applied to each chromosome separately (to all chromosomes jointly). The purple, red, and black circles represent significant SNPs selected by both EN50-sep and EN50-joint, by EN50-sep only, and by EN50-joint only, respectively. The y-axis represents raw P-values from SMA.

