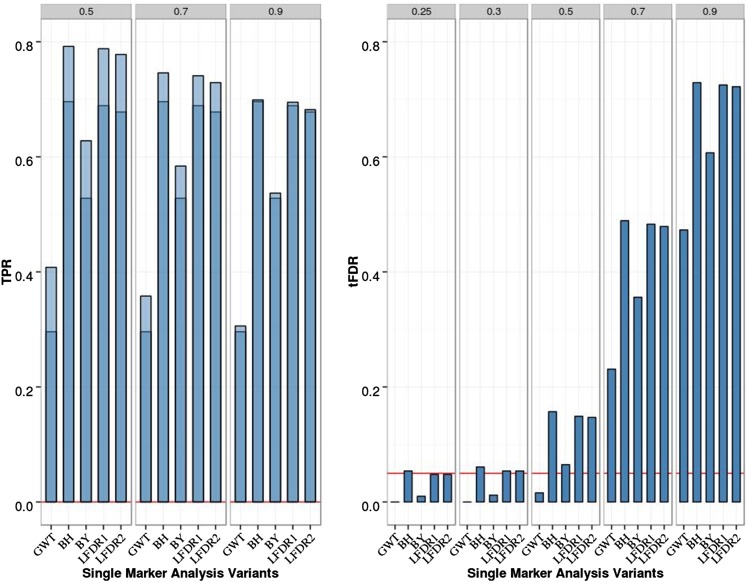
Figure 2.
Single-marker analysis (SMA) of chromosome 21 data with eight QTL, 200 replicates, and sample size N = 201. Empirical power [defined as true positive rate (TPR)] is on the left: Dark blue represents TPR1 as defined in the main text (TPR including only the significant QTL), and light blue represents TPR2 (TPR also including significant SNPs linked to QTL at absolute correlation threshold 0.5, 0.7, or 0.9). Empirical thresholded false discovery rate (tFDR) with absolute correlation thresholds 0.25, 0.3, 0.5, 0.7, and 0.9 is shown on the right: Red horizontal line represents the tFDR value of 0.05. GWT, genome-wide threshold that represents the P-value threshold 5.5 × 10⁻⁸; BH, Benjamini–Hochberg; BY, Benjamini–Yekutieli; LFDR1 and LFDR2, local FDR-based thresholding using different estimators of the proportion of true null hypotheses (see main text for details).

