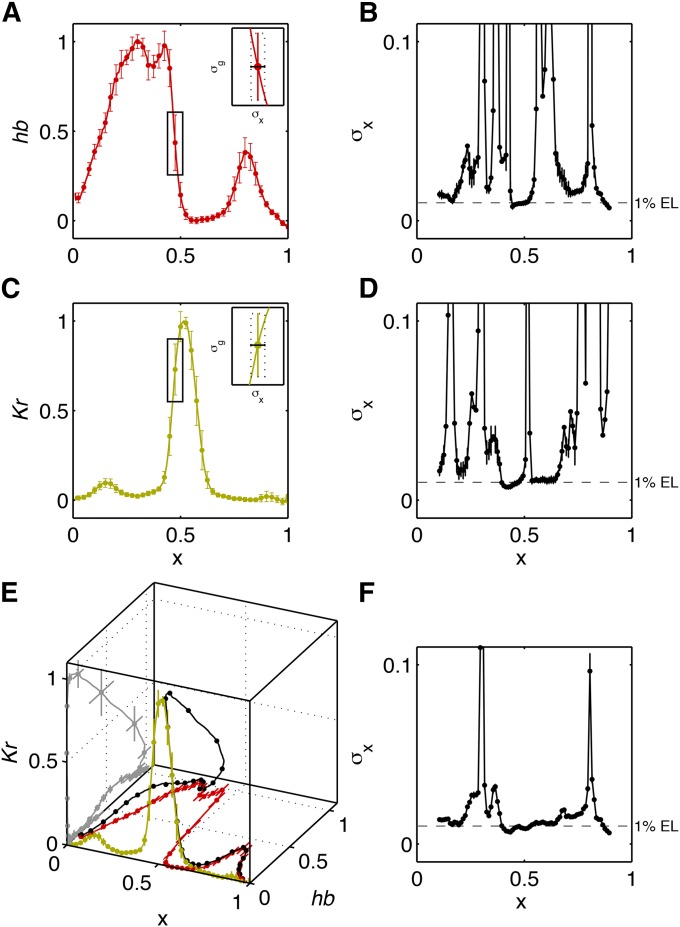
Figure 14.
Positional error for a single gene and a pair of genes. (A) The mean hb profile and standard deviation across embryos of data set A, as a function of fractional egg length. The inset shows a close-up with the positional error σx determined geometrically from the mean and the variability σg of the profiles. (B) Positional error for hb, computed using Equation 17 (dashed line corresponds to σx = 0.01). Error bars are obtained by bootstrapping 10 times over embryo subsets. (C and D) Plots analogous to A and B for Kr. (E) Three-dimensional representation of hb and Kr profiles from A and C as a function of position x. The mean and standard deviations of the gene expression levels are shown in the {hb, Kr} plane in a gray curve with error bars; cf. the joint distribution of hb and Kr expression levels in Figure 11A. The black curve that extends through the cube volume shows the average expression “trajectory” as a function of position x. (F) Positional error computed using Equation 21 for the {hb, Kr} pair.

