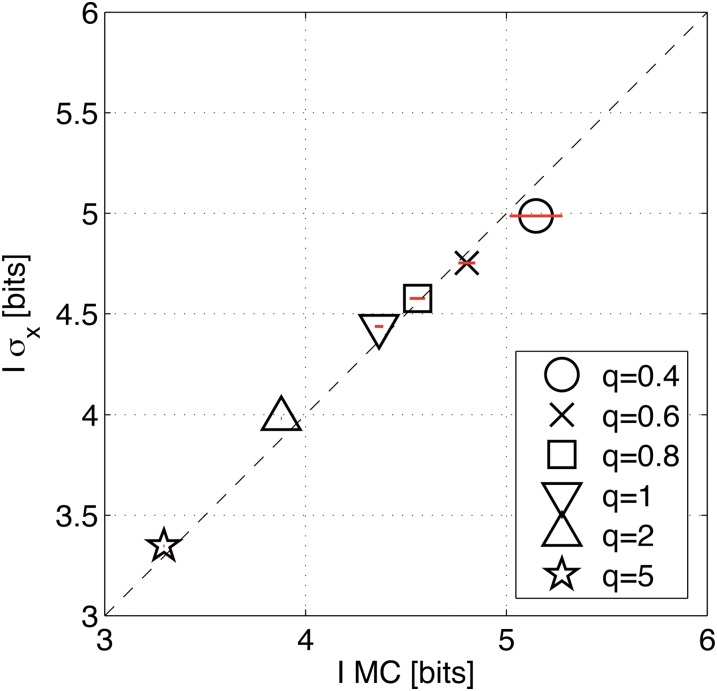
Figure 16.
The validity of the small noise approximation. Synthetic data were generated from data set A by keeping the mean profiles as inferred from the data, forcing the covariance matrix to be diagonal (by zeroing out the off-diagonal terms), and multiplying the variances by a tunable factor q (see inset); q = 1 corresponds to measured variances in the data and q < 1 (q > 1) corresponds to decreasing (increasing) amount of variability. For each q, positional information was estimated using Equation 21 (vertical axis) or using Monte Carlo integration (horizontal axis). Error bars are SD across 10 independent Monte Carlo integrations for every q.

