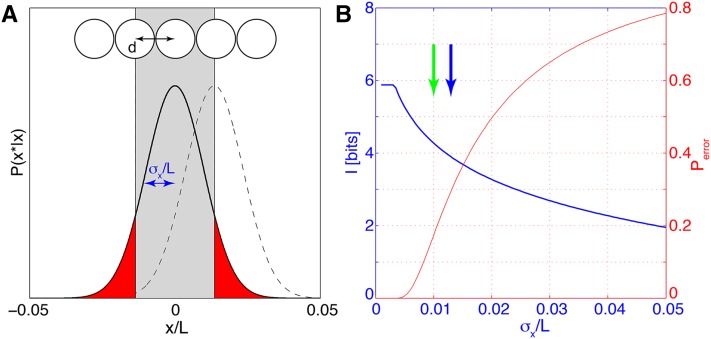
Figure 4.
Positional information, error, and perfect identifiability. (A) Nuclei, separated by distance d, decode their position from gap gene expression levels (top). The probability P(x*|x) for the estimated position x* is Gaussian (solid black line for the central nucleus and dashed line for the right next nucleus); its width is the positional error σx. The probability Perror that the central nucleus is assigned to the wrong lattice position is equal to the integral of the tails |x*| > d of the distribution P(x*|x) (red area). (B) Positional information (blue) and probability of false assignment (red) as a function of positional error σx. Blue arrow indicates the value of positional error σx = d used for the toy example in A; specifically we used Nn = 59 nuclei uniformly tightly packing the central 80% of the AP axis (L = 0.8 and thus d = L/Nn). In comparison, the 1% positional error inferred from data in Dubuis et al. (2013b) corresponds to the green arrow. The information is computed using Equation 22 and made to saturate at Imax = log2(Nn) bits (perfect identifiability). All parameters are chosen to roughly match the results of the Drosophila gap gene analysis.

