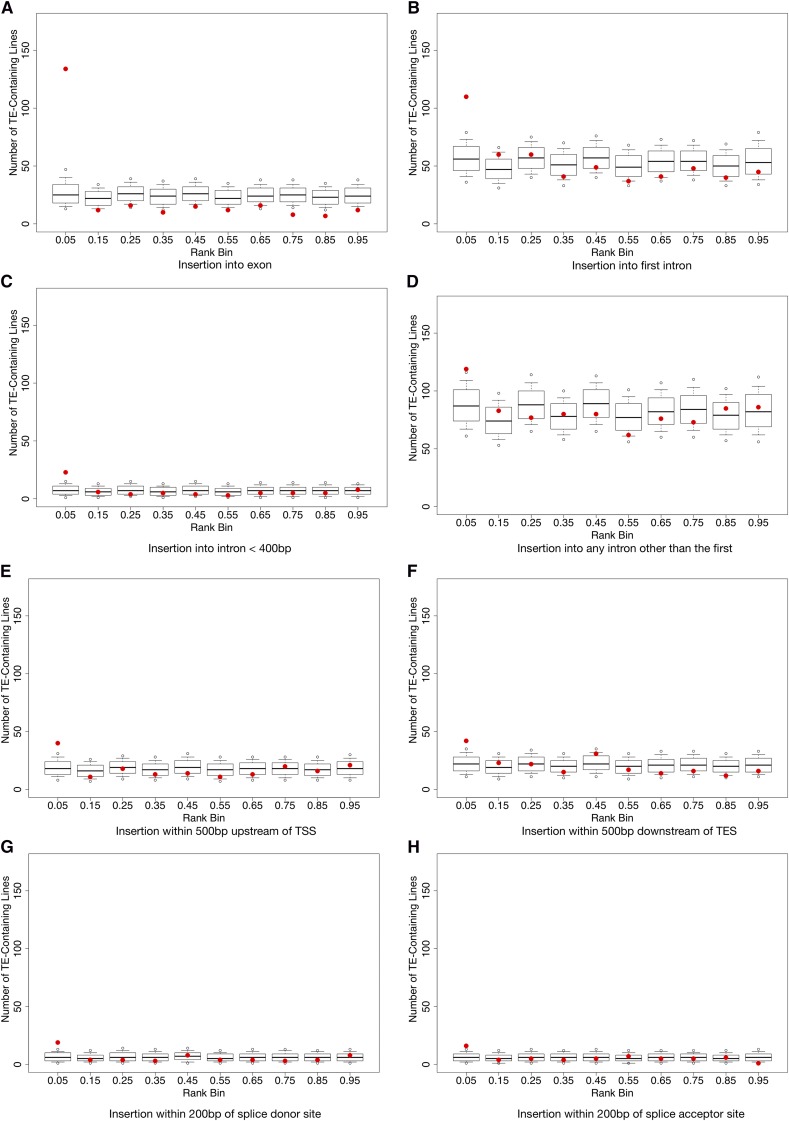
Figure 1.
Normalized rank expression of transposable elements. Observed numbers of TE-containing lines per rank bin vs. 10,000 permutations. Red dots indicate the observed number of TE-containing lines; box plots show permutations. Box plot tails indicate the 2.5% and the 97.5% confidence intervals. Open circles above and below the box plots indicate the 0.5% and the 99.5% confidence interval. (A) TE is in an exon, (B) TE is in a 1st intron, (C) TE is in an intron ≤400bp in length, (D) TE is not in 1st Intron, (E) TE ≤ 500bp from TSS, (F) TE ≤ 500bp from TES, (G) TE ≤ 200bp from a donor site, and (H) TE ≤ 200bp from an acceptor site.

