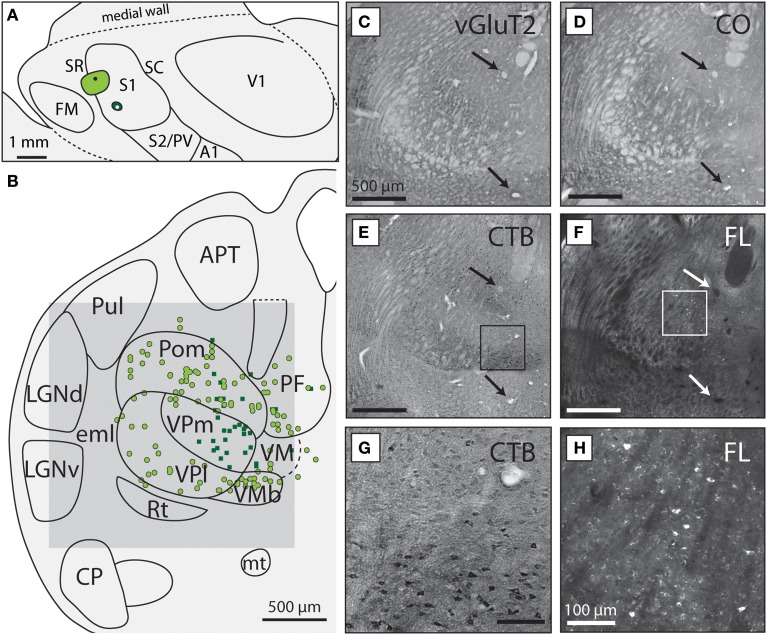
Figure 2.
VPm and VPl project to different body representations within S1. (A) Reconstruction of the flattened cortical hemisphere from case 13-126 in which one injection of CTB (light green circle) was placed in the S1 body representation and one injection of FR was placed in the S1 face representation (dark green circle). (B) Reconstructed thalamic section showing the boundaries of different subcortical nuclei drawn from histologically processed tissue. Dorsal is up, lateral is to the left. Colored dots and squares correspond to labeled neuronal nuclei resulting from each injection, with light green circles projecting to the light green S1 body injection and the dark green squares projecting to the S1 face injection in (A). Dashed lines indicate borders that were more difficult to determine from the sections available. The gray box corresponds to the region of the light field and fluorescent images in (C–F). Light field image of tissue stained for (C) vGluT2, (D) CO, (E) CTB, and (F) unstained tissue visualized under fluorescence microscopy. The arrows in each box indicate the presence of blood vessels use to align tissue. The scale bar for (C–F) are all 500 μm. The boxes in (E) and (F) are magnified in (G) and (H), respectively, showing (G) neurons labeled with CTB and (H) FR. The scale bar for (G,H) is 100 μm. See Table 1 for abbreviations.

