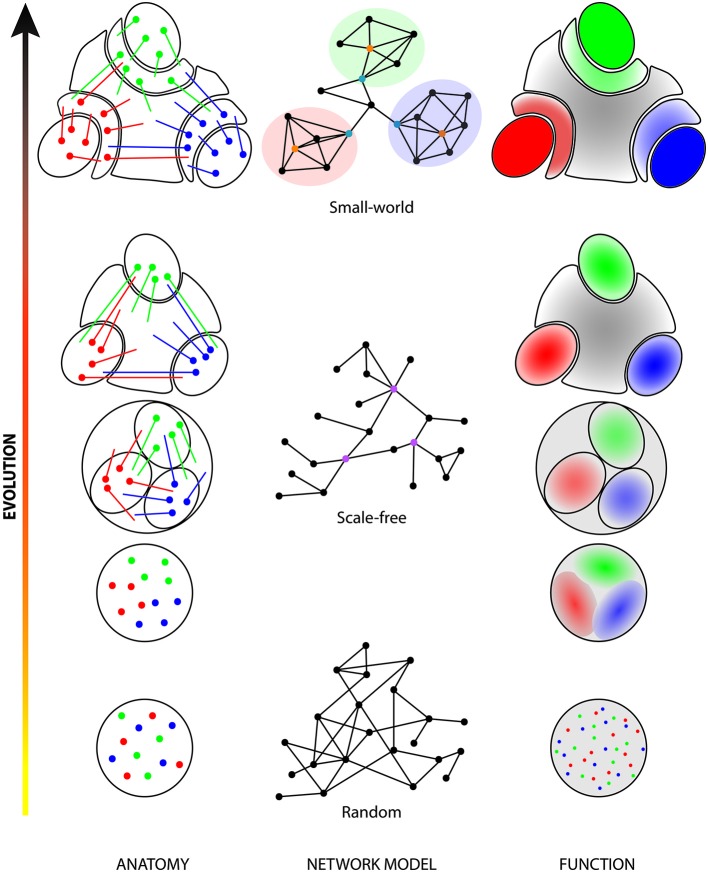
Figure 1.
Evolution of parcellation and network structure of the cerebral cortex. In early evolutionary stages (bottom row), cells processing different sensory stimuli or different parameters of a stimulus (red, green and blue dots) are intermingled. This random organization directly influences the structure of the network (random network; middle column, first level) and the functional architecture of the area (random distribution). During evolution, neurons of similar functions gathered together (left column) to form functional clusters (right column; shaded red, green and blue zones). Those clusters were initially highly interconnected with each other but, as they were pulled-out of the initial map, their segregation became more and more clear and connections between the clusters became less numerous. This resulted in more functionally homogeneous areas (shaded red, green and blue ovals) separated by areas highly connected with all clusters with heterogeneous properties (gray areas). The high number of connections between different clusters and the presence of several hubs (purple dots) in the network corresponds to a scale-free architecture (middle column, second level). In higher mammals (top row), the initial clusters (plain red, green and blue ovals) are almost completely separated from each other’s and new intermediate secondary sensory areas (shaded red, green and blue crescents) appeared. Those are highly connected with the initial clusters and, together, they now form cortical modules (highlighted areas of the network). Those modules contain provincial hubs (orange dots) that represent areas highly connected with other areas of the same module. Intermediate areas, which are also connected with other intermediate and multisensory areas, can be considered as connector hubs (turquoise dots). This organized structure resulted in the development of the cortical hierarchy and of the small-world network architecture (middle column, third level). In the left column, colored dots are cell bodies and colored lines represent cortical projections. In the middle column, dots are areas and lines are connections between those areas. In the right column, red, blue and green dots or areas indicate different functional properties. Gray color indicates a heterogeneous function.

