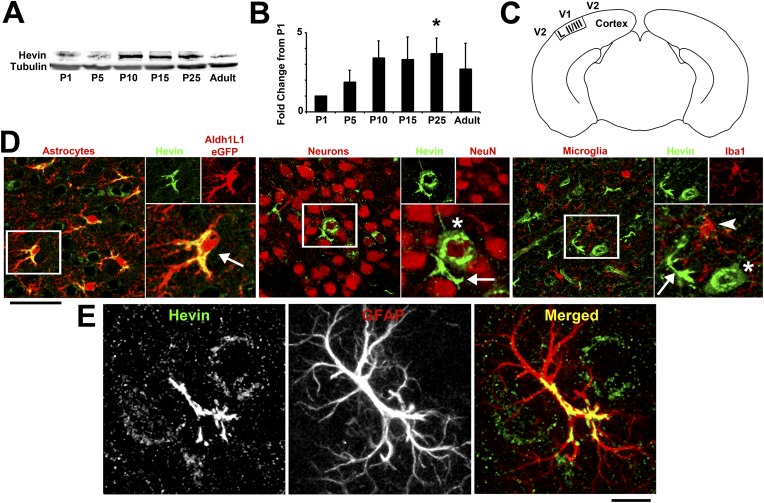
Figure 1. Hevin expression by astrocytes is developmentally regulated in the cortex.
(A) Representative Western blots showing the developmental timeline for hevin expression in mouse cortex and hippocampus (tubulin was used as a loading control). (B) Quantification of Western blot analysis of hevin expression shows high expression between P15–P25. Data is presented as fold change compared to P1 levels (n = 3 animals per age; p < 0.05; one-way ANOVA with Dunnett's post hoc test). (C) Schematic diagram of a coronal slice through mouse brain shows the synaptic zone of primary visual cortex (V1) where EM, IHC and Golgi-cox staining analyses were performed. Layer II/III neurons of the visual cortex heavily project their dendrites to this region (D) IHC staining reveals that hevin expression (green) overlaps with all astrocytes (left, arrow) and a small subset of neurons (middle, asterisk) in V1, with no overlap seen with microglia (right, arrowhead). Cell-specific markers in red: Aldh1L1-EGFP for astrocytes, NeuN for neurons, Iba1 for microglia. Scale bar, 50 µm. (E) The rarely occurring GFAP+ astrocytes (red) in healthy visual cortex also express hevin (green). Scale bar, 10 µm.

