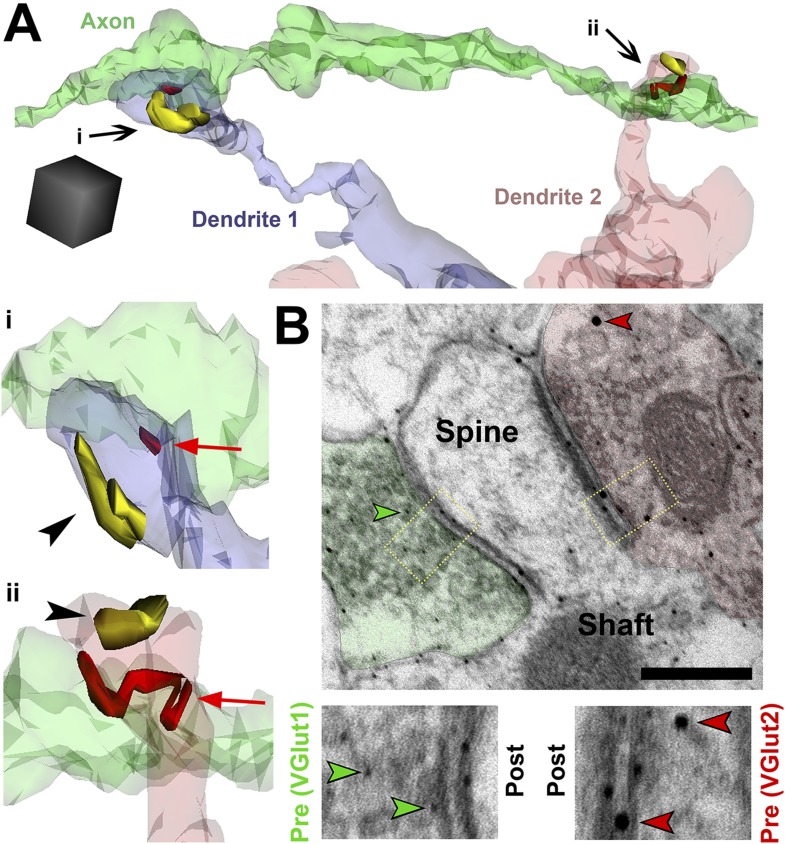
Figure 7. SMECs represent potential sites for competition between thalamocortical and intracortical projections.
(A) Reconstructed axon (green) from P25 hevin KO contacting multiple SMECs on two different dendrites. Quantification revealed that axons that synapsed with at least one SMEC also synapsed with another SMEC roughly 50% of the time. Scale cube, 0.5 µm3. i–ii, Zoomed-in images reveal that each SMEC makes an excitatory synapse (red; arrow) with the reconstructed axon as well as a second excitatory synapse (yellow; arrowhead) with an additional axon (not shown). (B) Immuno-EM image from V1 in P14 WT showing a SMEC simultaneously contacting a VGlut1+ (green) and VGlut2+ (red) axonal bouton. Higher magnification images (below) highlight the size difference between the small VGlut1 (green arrowheads) and large VGlut2 (red arrowheads) Nanogold particles. Scale bar, 250 nm.

