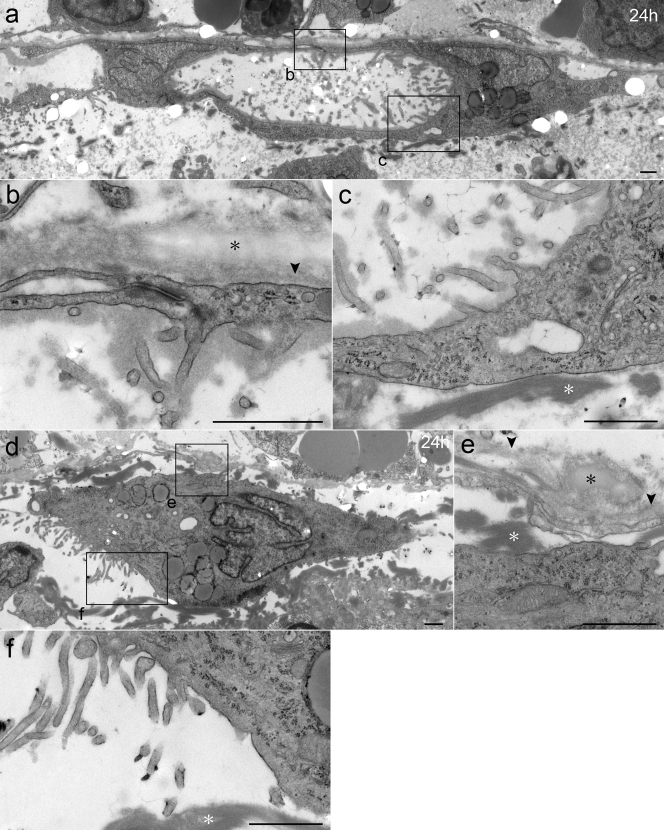
Figure 6. Micrographs of TEM showing isolated MCs in adherent area at 24 hours.
(a–c) Saccular MCs are seen on the BM of the opposite peritoneum. Two nuclei are seen. (b) Cell-cell junctions are seen. The BM (arrowhead) and elastic fibers (black asterisk) of the opposite peritoneum are indicated. (c) The MCs have turned their microvilli inward, and their basal surfaces toward the surrounding fibrin. (d–f) The isolated and tall MCs in the adherent area at 24 hours. The MC is located away from the BM of the opposite peritoneum. It has detached from the BM and is in close proximity to fibrin. (f) The microvilli resemble those of normal MCs. Bar, (a–f) 1 μm.

