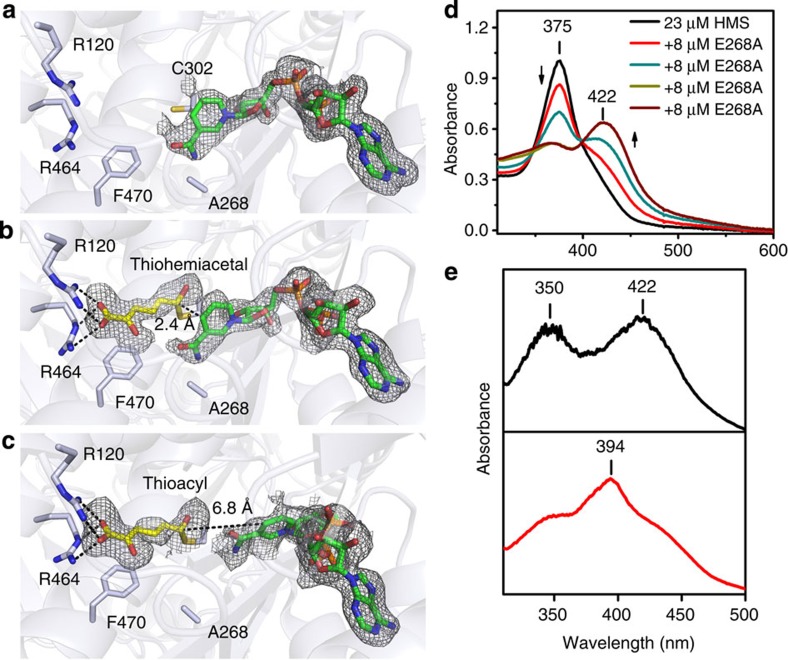
Figure 3. Crystal structures of the E268A mutant and its solution and single-crystal electronic absorption spectra.
(a) Structure of the active site of the co-crystallized E268A-NAD+ binary complex, (b) a thiohemiacetal intermediate obtained by soaking the E268A-NAD+ crystals with 2-HMS for 30 min before flash cooling and (c) a thioacyl intermediate obtained by soaking the E268A-NAD+ crystals with 2-HMS for 180 min before flash cooling. (d) Solution electronic absorption spectra of a titration of 2-HMS with E268A. (e) Single-crystal electronic absorption spectrum of the intermediate in b (top panel) and single-crystal electronic absorption spectrum of the intermediate in c (bottom panel). Protein backbone and residues are shown as light blue cartoons and sticks, respectively. The substrate and intermediate are shown as yellow sticks, and NAD+ and NADH are shown as green sticks. The omit map for ligands is contoured to 2.0 σ and shown as a grey mesh.

