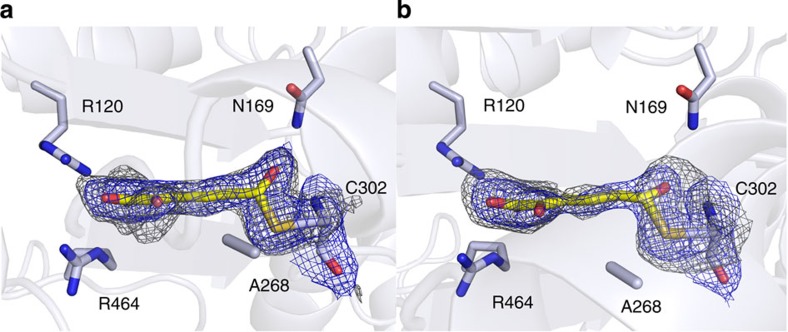
Figure 5. Crystal structures of two distinct catalytic intermediates.
(a) Electron density map of the thiohemiacetal intermediate obtained from E268A-NAD+ crystal soaked with 2-HMS for 30 min. (b) Electron density map of the thioacyl intermediate obtained from E268A-NAD+ crystal soaked with 2-HMS for 180 min. The 2Fo−Fc electron density map for ligands and Cys302 is contoured to 1.0 σ and shown as a blue mesh. The omit map for ligands and Cys302 is contoured to 2.0 σ and shown as a gray mesh.

