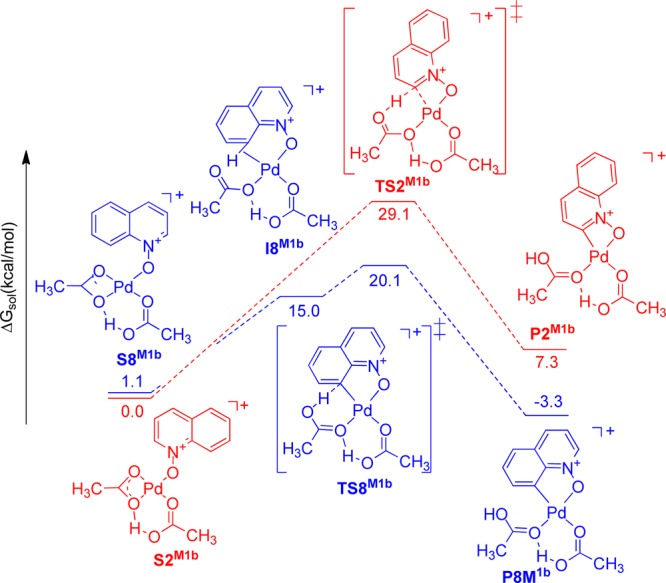
Figure 8.

Solvation Gibbs free energy diagram (ΔG in kcal mol–1, at 298 K, in acetic acid) for the relevant intermediates, transition states, and products in mechanism 1b.

Solvation Gibbs free energy diagram (ΔG in kcal mol–1, at 298 K, in acetic acid) for the relevant intermediates, transition states, and products in mechanism 1b.