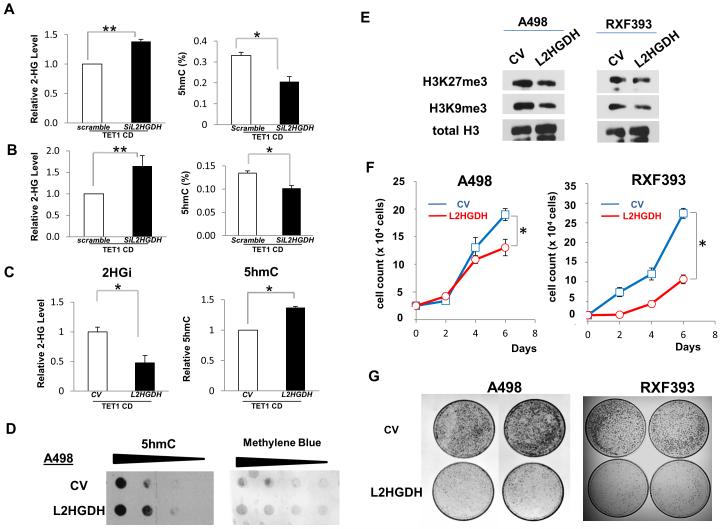
Figure 4. Knockdown or ectopic expression of L2HGDH is associated with changes of intracellular L-2HG concentration and DNA 5hmC level.
siRNA to L2HGDH was co-transfected with TET1 catalytic domain (CD) in HK-2 cells (A) and HEK293 cells (B). Noncoding scramble was used as control siRNA (siControl). Mass spectrometry confirmed raised 2HG with L2HGDH knockdown (left panels). Genomic DNA was also isolated to determine 5hmC level by ELISA (right panels). (C) HEK293 cells were transiently co-transfected with TET1 CD and either L2HGDH cDNA or control vector (CV). Cells were subsequently challenged for 4hrs with 1mM L-2HG octyl ester. Metabolites were extracted for measurement of intracellular total 2HG level and analyzed by LC-MS (left panel). Genomic DNA was also isolated to determine 5hmC level by ELISA (right panel). Error bars indicate standard deviation from at least two independent experiments. (**) p < 0.005, (*) p < 0.05 (D) 5hmc dot blot assay in A498 cells +/- L2HGDH cDNA. Methylene blue blot is included for loading control. (E)Histone immunoblotting in A498 and RXF393 cells +/- L2HGDH cDNA. (F and G) Proliferation and colony formation assays in RCC cells +/- L2HGDH cDNA.

