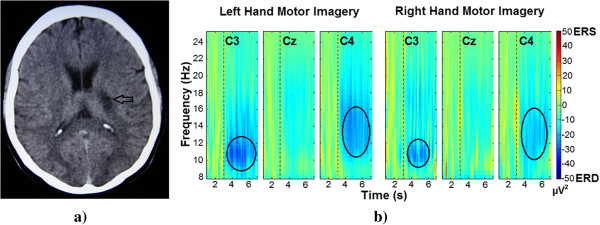
Figure 3.

Female patient CT image and averaged TFRs. a) Representative image of the female patient’s CT (Computed Tomography). The black arrow indicates the location of the residual injury. b) Averaged TFR for left and right hand (affected limb) motor imagery in 8 Hz to 25 Hz from 1 s to 7 seconds. Dashed line at 3 seconds indicates the motor imagery onset. The black circles highlight the generated ERD.
