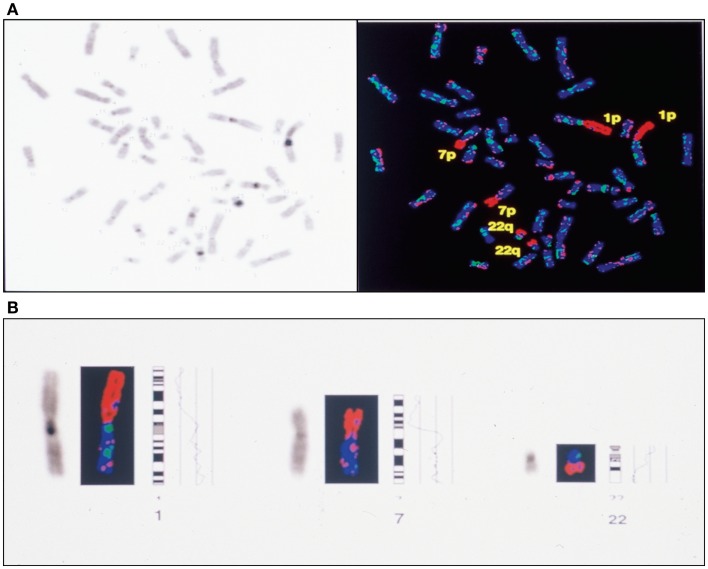
Figure 6.
Complete CGH analysis of one large endometriotic peritoneal implant presented in (A). Compilation of fluorescence ratio profiles from 10 different metaphases was used to calculate the average ratio profiles of this sample. As shown, copy number losses are distributed along chromosomes 1p, 7p and 22q. DAPI staining on the left, and digitized fluorescent image on the right. More detailed representation of the deleted chromosomal segments located on chromosomes 1, 7 and 22 (B).

