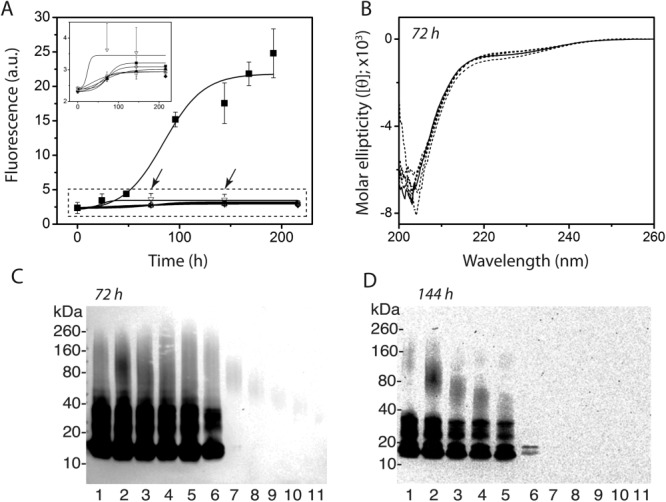
Figure 4.

DSO self-propagation reactions. (A) ThT intensities of monomeric αS (50 μM) in 20 mM Tris with 50 mM NaCl incubated at 37°C agitated (▪), and quiescent (dashed box; inset) with 0.1 μM DSO4–13 (▪) DSO3–10 (○), DSO3–6 (▴), DSO2–5 (□), and in the absence of DSOs (▿) (n = 3). (B) The quiescent reactions in (A) after 72 h were analyzed by far-UV CD spectroscopy—αS in the absence of (solid line) and in the presence of (dashed lines) DSO seeds. C and D) Western blot analyses of supernatants of the reaction aliquots removed at 72 and 144 h from (A) (indicated by arrows) after centrifugation at 18,000g, using Syn211 monoclonal antibody. αS alone (lane 1) and with DSO4–13, DSO3–10, DSO3–6, DSO2–5, and DSO2–3 (lanes 2–6, respectively) at 72 h (C and D, respectively).
