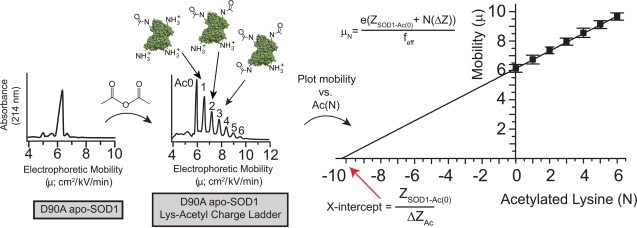
Figure 1.

Using “protein charge ladders” and capillary electrophoresis to measure the net charge of native ALS-variant SOD1. Left plot: a capillary electropherogram of recombinant D90A apo-SOD1 at pH 7.4. Center plot: a capillary electropherogram of a “protein charge ladder” of D90A apo-SOD1 prepared by acetylating its surface Lys-ε-NH3+ (to electrostatically neutral Lys-NHCOCH3) with acetic anhydride. Right plot: a plot of the electrophoretic mobility (µ) of each rung of the ladder versus the number of acetylated lysines (N) of each rung. The x-intercept of this plot is equal to ZSOD1-Ac0/ΔZAc, that is, the net charge of unmodified protein (ZSOD1-Ac0) divided by the change in net charge imparted by each lysine acetylation (ΔZAc); feff = hydrodynamic drag; e = approximate charge of an electron. The x-intercept can be considered to represent, per se, the approximate number of Lys-NH3+ groups that would need to be added to the negatively charged protein in order to cause the protein to have an electrophoretic mobility of zero, and thus a net charge of zero.
