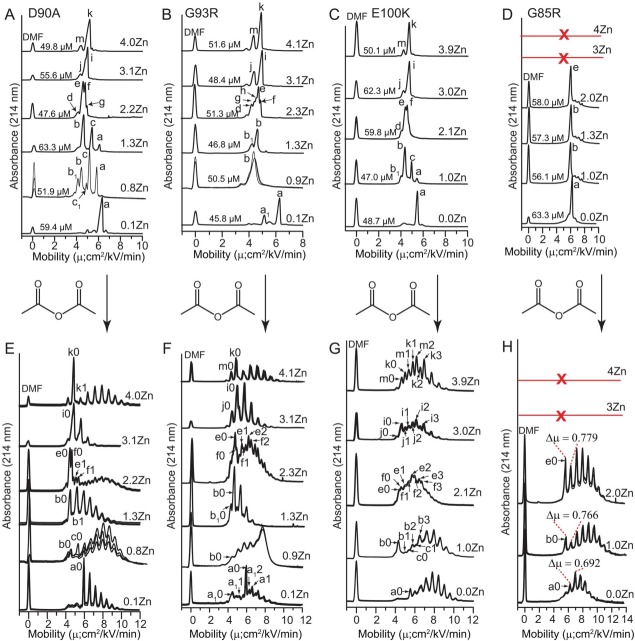
Figure 2.
Capillary electrophoresis of Zn2+ derivatives of ALS-variant SOD1 and Lys-acetyl protein charge ladders. (A–D) Capillary electropherograms of ALS-variant SOD1 with increasing stoichiometries of bound Zn2+. Each electropherogram is an overlay of 3 separate electropherograms from replicate experiments. Electrophoretically unique species are labeled with lower case letters and subscript numbers (a-m). The concentration of each SOD1 derivative at the time of injection is listed per dimer. The red line and “X” indicates that the G85R protein did not coordinate > 2 Zn2+/dimer. E-H) Protein charge ladders of each Zn2+ derivative of each ALS-variant SOD1 protein from panels A–D, prepared by acetylation of lysine-ε-NH3+ with acetic anhydride. Each electropherogram is an overlay of three separate electropherograms from repeated experiments. Labels such as “a0, a1, b0, b1” denote acetylation number of each electrophoretically unique species from parts A–D (i.e., “a0” = unacetylated or zeroth rung of species “a”; “b1” = singly acetylated or first rung of species “b”). Acetylation of minor species in panels A–D such as “d” in G93R were not detectable and are not labeled. Note: the E100K charge ladder of Zn3- and Zn4-SOD1 exhibited two overlapping ladders that might reflect differing reactivity of Lys residues (including K100).

