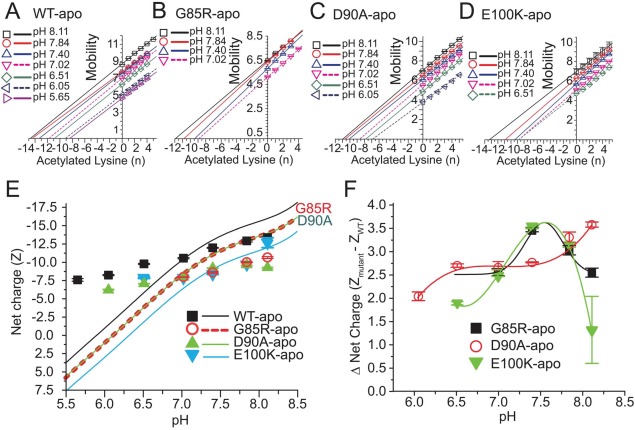
Figure 7.
Effect of solvent pH on net electrostatic charge of ALS-variant apo-SOD1. (A–D). Plot of electrophoretic mobility of rungs of charge ladders of ALS-variant apo-SOD1 (from Supporting Information Fig. S5) versus the number of acetylated lysines of each rung at each value of pH. (E) The measured and predicted (formal) net charge of WT and ALS-variant apo-SOD1 from pH 5.5 to 8.5. The formal values of net charge are indicated by solid and dashed lines and were calculated with the Henderson–Hasselbalch equation (see Experimental Methods). The measured values of net charge were derived from plots in part A–D. (F) Plot of the “charge gap” (i.e., the difference in net negative charge of variant and WT apo-SOD1) across pH 5.5–8.5.

