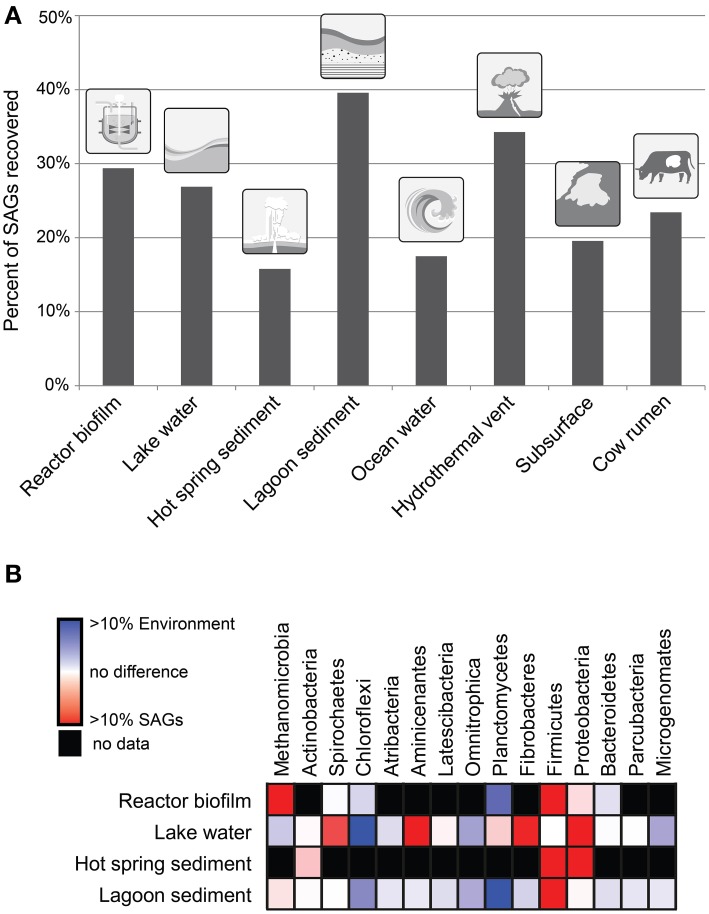
Figure 1.
(A) Percentage of single cells sorted from a variety of environmental samples that were successfully amplified by MDA. A minimum of 800 single cells were sorted for each of these sites. (B) Abundance of taxa in 16S rRNA gene tag sequence data as compared to the SAG libraries for four diverse environmental samples. Taxa represent phyla of bacteria and the archaeal class Methanomicrobia.

