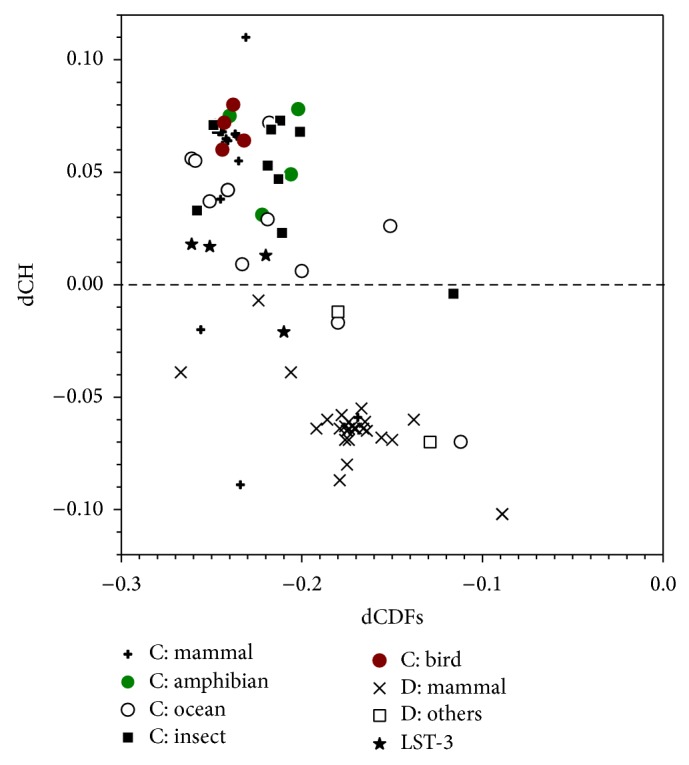
Figure 2.

CH-CDF analysis for all DBC1 and CCAR1 proteins. The x-axis and y-axis are the CDF and CH distances, respectively. The CDF distance is calculated from PONDR-VSL2 prediction. All DBC1 proteins are split into two groups: mammal and others (starts with “D” in the legend). All CCAR1 proteins are arranged into six groups, including mammal, amphibian, aquatic animals, insect, and bird (as denoted by “C” in the legend). Nematode LST-3 proteins are in one group.
