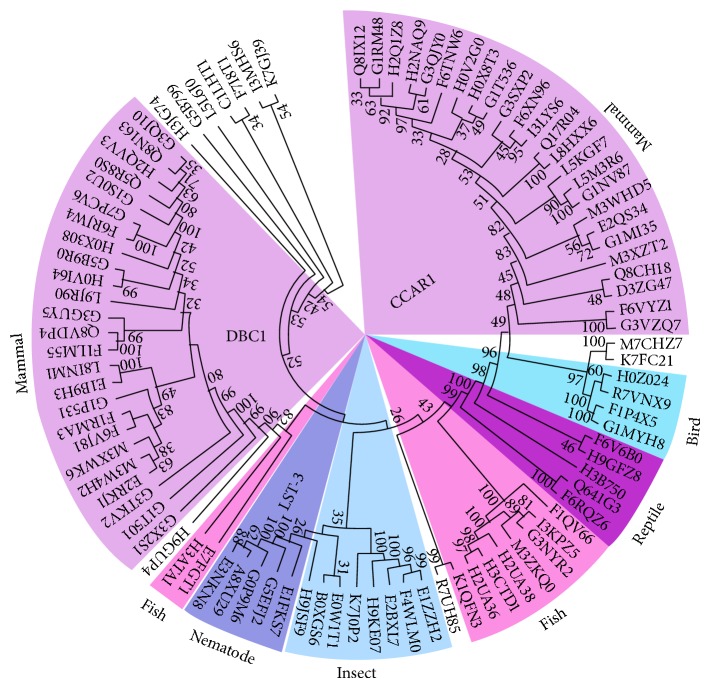
Figure 3.
Phylogenetic analysis of DBC1 and CCAR1 homologs. A phylogenetic tree was built for all 93 protein sequences in 65 species as listed in Table S1 using Mega5 software. All DBC1 proteins are on the left, while all CCAR1 proteins are on the right. The nematode LST-3 proteins, although closely related to CCAR1, are categorized into a subgroup of CCAR1. The colored shadows cover several regions that are extensively discussed in the paper.

