
Figure 8.
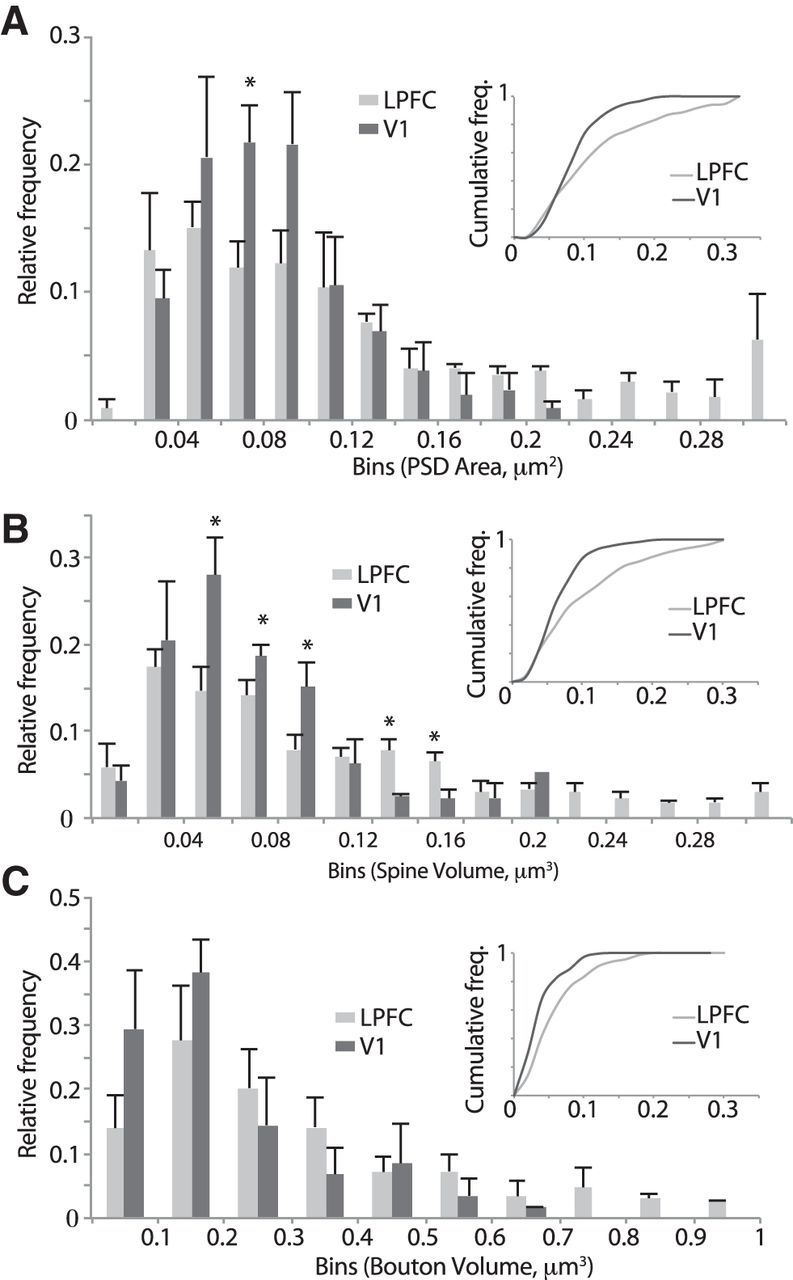
Population distribution histograms of presynaptic and postsynaptic features of synapses in LPFC and V1. Relative and cumulative frequency distribution histograms of the following: A, PSD areas. B, Spine volumes. C, Bouton volumes of asymmetric axospinous synapses in layers 2–3 neuropil of LPFC and V1. *p < 0.05. Note the more positively skewed frequency distribution and rightward shift of the cumulative distribution in LPFC versus V1. Error bars indicate SEM.