Figure 1.
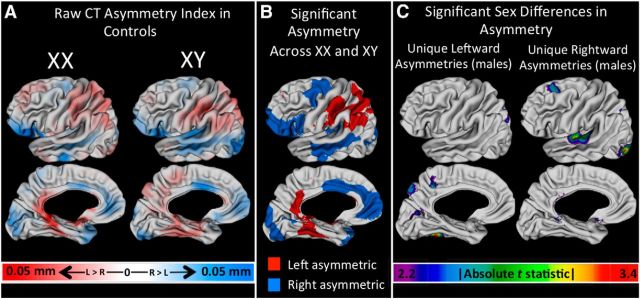
CT asymmetry in controls. A, Maps of mean CT asymmetry in female and male controls. B, Vertices of statistically significant leftward (red) and rightward (blue) CT asymmetries that are indistinguishable between males and females. C, Regions of statistically significant sexual dimorphism in CT asymmetry.

