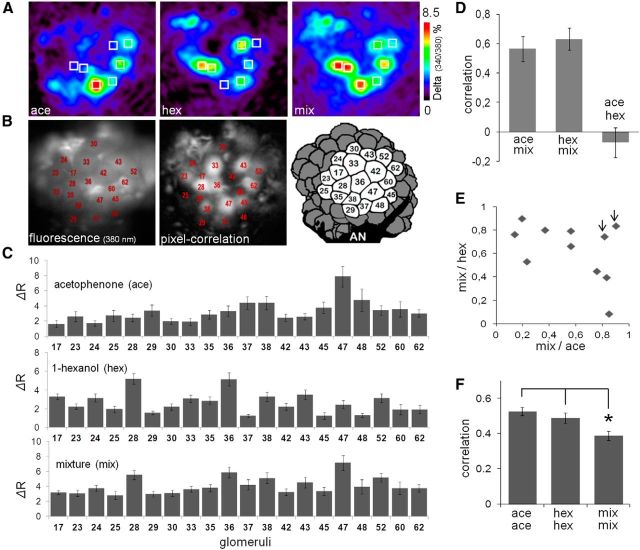
Figure 1.
Imaging of odor elicited calcium signals in projection neurons. A, Color-coded calcium images represent the average of odor responses from 250 to 750 ms after odor onset. From left to right, Images are responses to acetophenone, 1-hexanol, and their mixture (10:10) in the same honey bee. The seven squares represent the same seven glomeruli in different odor responses to aid visualization of the differences between patterns. B, Left, Basal fluorescence image observed with 380 nm excitation light and LP510 emission filter after staining the PNs with FURA-dextran. The glomeruli were identified according to size, shape, and position by comparison with the honey bee AL atlas (Flanagan and Mercer, 1989; Galizia et al., 1999). Middle, Pixel-correlation image (see Materials and Methods) used as an additional tool to aid glomeruli identification. Dark glomeruli do not mean lack of staining; these glomeruli were not activated by the odors and consequently produce low correlation values between neighboring pixels. Right, Schema of the dorsal view of the AL showing the 20 glomeruli used in our analyses. AN, Antennal nerve. C, Quantitative evaluation of the odor responses via change of fluorescence from the reference window (ΔR) from 250 to 750 ms after odor onset in 20 glomeruli. Average ± SEM of odor responses from 11 control bees (top to down: acetophenone, 1-hexanol, and mixture). Numbers in the abscissa correspond to the identity of the glomeruli. D, Pearson's correlation coefficients between response patterns were used to evaluate similarity between odor patterns. The correlation coefficients of three different pairs (ace-mix, hex-mix, ace-hex) were calculated in each control bee. Data are average ± SEM of 11 control bees. E, Scatter plot of the correlation coefficients between mixture and either pure components (hexanol or acetophenone). Each point represents one control bee. Two arrowheads indicate two bees with the highest correlation coefficients between the pure components. F, Correlation coefficients between patterns elicited by the same odor in different bees. Vertical bars represent average ± SEM from a total 55 correlation values that result from arranging 11 controls bees in pairs. The representation of mixture was less conserved across animals than the representation of the pure odors. *p < 0.01 contrasts after ANOVA (F(2,162) = 6 0.97; p = 0.001).

