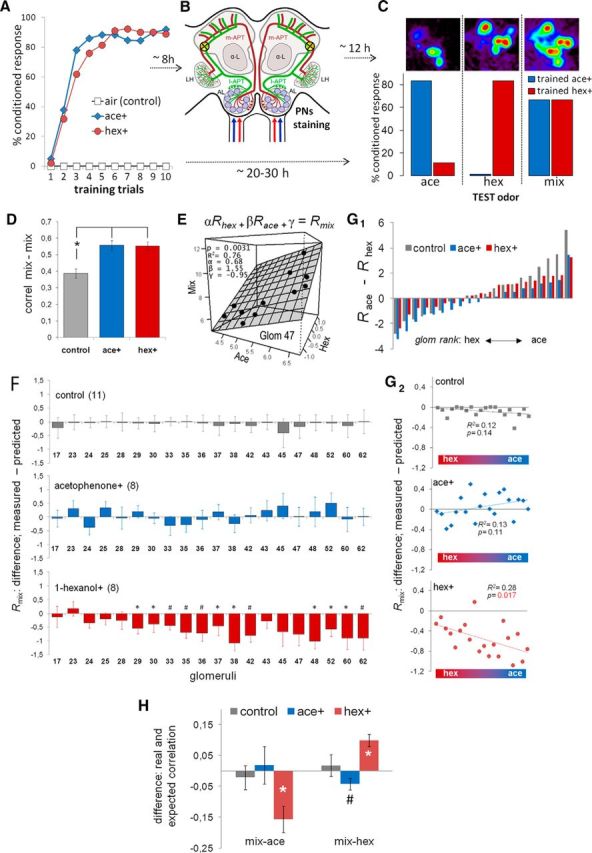
Figure 2.

Changes in the responses to the mixture after appetitive olfactory conditioning. A, Three groups of bees were trained using appetitive conditioning. Each bee received 10 trials with 2 m sucrose solution separated by 10 min intertrial intervals. Control bees received the reward paired with clean air provided by the odorgun. The other two groups received 1-hexanol or acetophenone as conditioned odor. Learning performance was recorded during conditioning as percentage of animals that extended the proboscis upon stimulation with odor. B, Eight hours after conditioning, projection neurons were stained bilaterally using fura-dextran targeted to where the l-APT enters the lateral calyces of the mushroom bodies (yellow circles). m-APT, Medial antenno-protocerebal tract; l-APT, lateral antenno-protocerebral tract; LH, lateral horn; α-L, alpha lobe. C, On the next day, the bees were prepared for calcium imaging of odor-induced signals on the dorsal side of the antennal lobe (top). Activity patterns were measured three times each to 1-hexanol, acetophenone, and the binary mixture, presented in random order separated by 1 min intervals. A set of trained bees not stained for imaging was used to determine the strength of olfactory memory and odor discrimination (bottom). All honey bees underwent three test trials without reward using: (1) the conditioned odor (1-hexanol or acetophenone), (2) a different odor that they have not experienced before (1-hexanol or acetophenone), and (3) the binary mixture containing both odors in same proportion. Bar colors represent the odor used for conditioning. The order of the three odors was randomized across animals (1-hexanol-trained bees, n = 20; acetophenone-trained bees, n = 18). Control bees are not shown because they did not evoke any conditioned response. D, Average ± SEM of the correlation coefficients between mixture-elicited activation patterns across bees. The correlation was calculated between bees from the same training group: control (gray), ace+ (blue), and hex+ (red), ANOVA: F(2,108) < 0.0001. *p < 0.001 (post hoc contrasts). E, A best fit linear equation was obtained for each glomerulus to estimate the response of the mixture as a function of the responses to 1-hexanol and acetophenone. Graph represents an example of the best-fit linear equation (plane) of glomerulus 47 derived from 11 data points (11 control bees). F, Average ± SEM of the difference between the measured and the predicted response to the mixture for each glomerulus in the three different groups of bees. The numbers in the abscissa indicate the identification of the glomeruli. The differences shown in the graph were calculated as the measured response minus the predicted response. *p < 0.05, between measured and predicted values (paired t test). #p < 0.01, between measured and predicted values (paired t test). From top down, control group (n = 11), ace+ group (n = 8), and hex+ group (n = 8). G1, Glomeruli were ranked according to the difference of the average response to 1-hexanol and acetophenone in control bees. The ranking was made by subtracting the response to 1-hexanol (Rhex) from the response to acetophenone (Race). G2, The points in these plots correspond to the data (Rmix: measured − predicted) shown in F, but reorganized along the abscissa according to the ranking derived from G1. The red/blue color bar at the bottom of each plot represents the ranking of glomeruli from hexanol responders to acetophenone responders. The results of a linear regression analysis are displayed in each plot. H, The predicted responses to the mixture for each glomerulus were arranged to establish a predicted response pattern to the mixture. The correlation between patterns elicited by the pure odors and the predicted pattern to the mixture were designated predicted correlations. The figure shows the average ± SEM of the differences between the real and the predicted correlation between responses to the mixture and responses to the pure odors (mix-ace, mix-hex) in the three groups of bees (control, ace+, hex+). *p < 0.001, between real and predicted correlation (paired t test). #p = 0.06, in the case of correlation mix-hex after conditioning with acetophenone.
