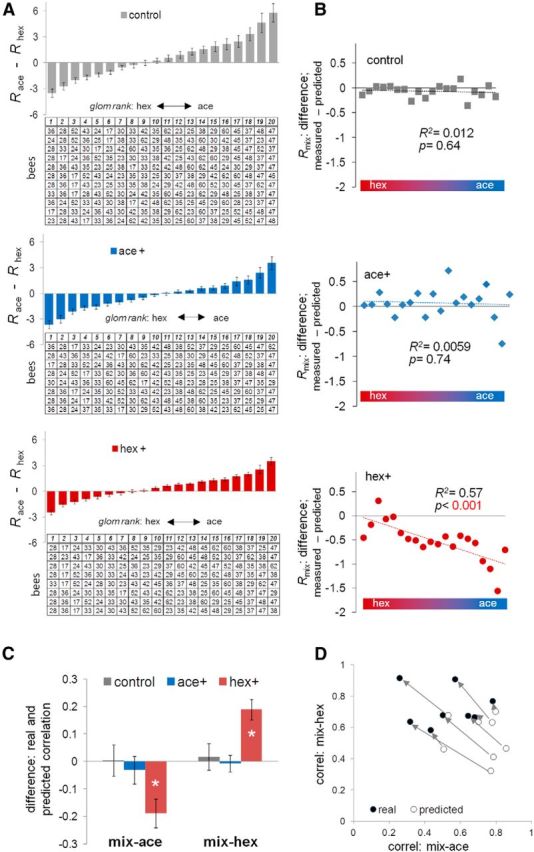
Figure 3.

Changes of correlation between the responses to the mixture and the pure odors based on individual bee response profiles. A, Glomeruli were ranked according to the difference of response to acetophenone and 1-hexanol in each individual bee. Three groups of bees (from top down: 11 control bees; 8 ace+ bees; 8 hex+ bees) are shown. In the tables: each row represents one bee, each column represents one category, and the numbers in the table indicate the identity of the glomeruli. The graphs (bars) show the average ± SEM of the difference between the responses to acetophenone and 1-hexanol in each group of bees along the ranking category (1–20). B, For each group of bees, the average of the difference between measured and predicted response to the mixture was plotted along the ranked categories (1–20). C, The average ± SEM of the differences between real and predicted correlation coefficients between the mixture and either pure components were calculated in each group of bees. *p < 0.001 (paired t test). D, For hex+ group, a scatter plot showing the predicted and real correlation coefficient between the mixture and the pure components. The eight open circles represent predicted correlation coefficients of eight bees in the hex+ group; the eight filled circles represent the real correlation coefficient in the same eight bees. The arrows indicate the shift from the predicted correlation to the real correlation of the same bee.
