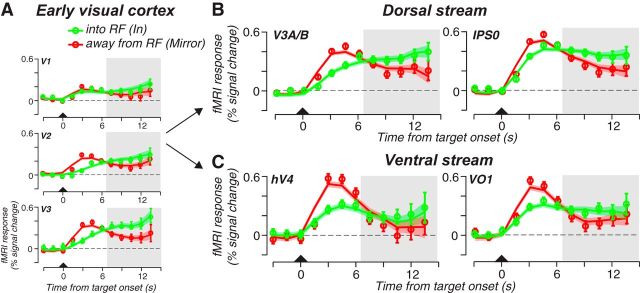
Figure 4.
Trial averaged time courses during the maintenance of planned antisaccades. A, First, the brief visual target (triangle) evoked a transient response in early visual areas in the part of the retinotopic map that represented the location of the visual target similar to planned prosaccades (Mirror RF to the saccade plan, red). Then, activity ramped up and persisted in the part of the retinotopic map that represented the saccade goal (saccade plan into RF, green). B, In the dorsal stream retinotopic ROIs, V3A/B and IPS0, spatially specific activity persisted when the planned saccade fell within the ROI's mapped RF quadrant. C, Similarly, activity persisted in ventral stream ROIs, hV4 and VO1, when the saccade goal matched the ROI's mapped RF quadrant. Shaded area bounds the delay-period activity. Open circles represent the mean fMRI response across trials and subjects. Error bars represent SEM. The solid line and error ribbon represents the mean and SEM from the model fits (see Materials and Methods). Model fits the observed data well; r2IN = 0.85; r2MIRROR = 0.87.

