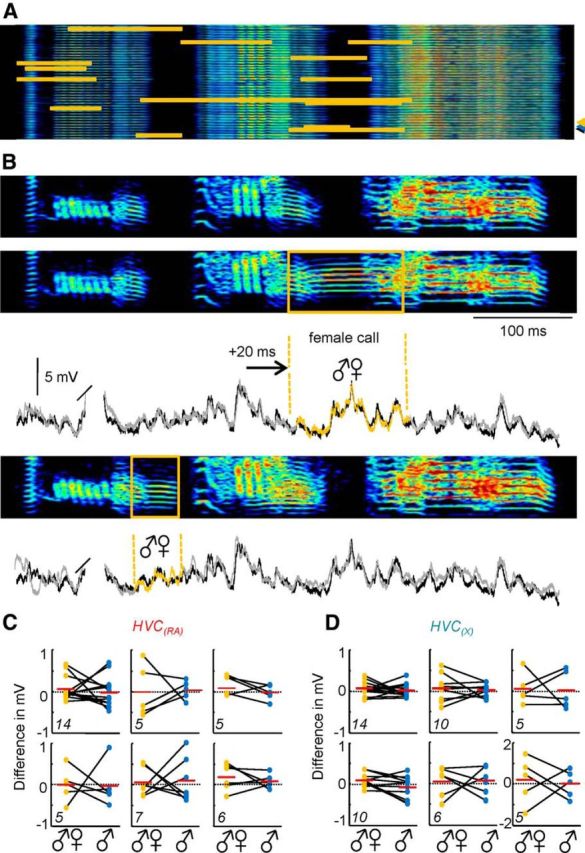
Figure 3.

Impact of an auditory perturbation during singing. A, The timing of female calls (indicated in orange) is shown across 42 motif sonograms from one bird. B, Sonograms of a control song motif (indicated in A by a blue arrowhead) and two motifs that include a female call (indicated in A by yellow and black arrowheads, respectively). Two overlays of intracellular traces of a single HVC(X) neuron recorded during the motifs shown above (black line, control motif; gray/orange line, motif with female call). C, D, The change in song-related membrane potential in the presence of a female call vocalization relative to control conditions for a population of six HVC(RA) (C) and six HVC(X) cells (D). Different parts represent single neurons. The total number of female calls analyzed per cell is indicated in the lower left corner of each part. Orange dots represent the difference between a single, subthreshold song-related trace recorded during a female call and the same epoch of an average subthreshold membrane potential from multiple motifs lacking a female call. An identical analysis for a portion of the motif without a female call is provided (blue dots) to allow for a statistical comparison. The first part in D displays the result for the example highlighted in B.
