Figure 5.
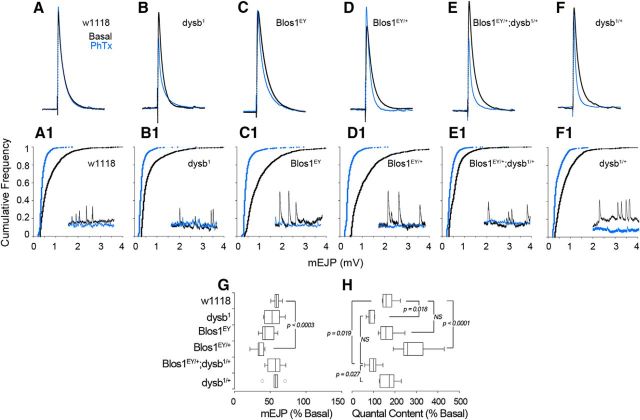
BLOC-1 gene dosage regulates synaptic homeostasis. A–F, Representative EJP traces. Black indicates baseline stimulated response; blue indicates response following acute 10 min incubation with 4 μm PhTx for each genotype. A1–F1, Reduced mEJP amplitudes following PhTx incubation (blue) compared with baseline (black). Representative mEJP traces shown in inset. G, Reduction in mEJP amplitude following toxin incubation. H, w1118 control, Blos1EY, and Blos1EY/+ animals display robust homeostatic increase in quantal content following toxin incubation, while dysb1 and Blos1EY/+;dysb1/+ animals did not. A1–E1, Plots graph between 909 and 2888 randomly selected mEJP events. All comparisons in G and H were performed with one-way ANOVA followed by Bonferroni's multiple comparison test. Data were obtained from 6 to 11 animals per genotype.

