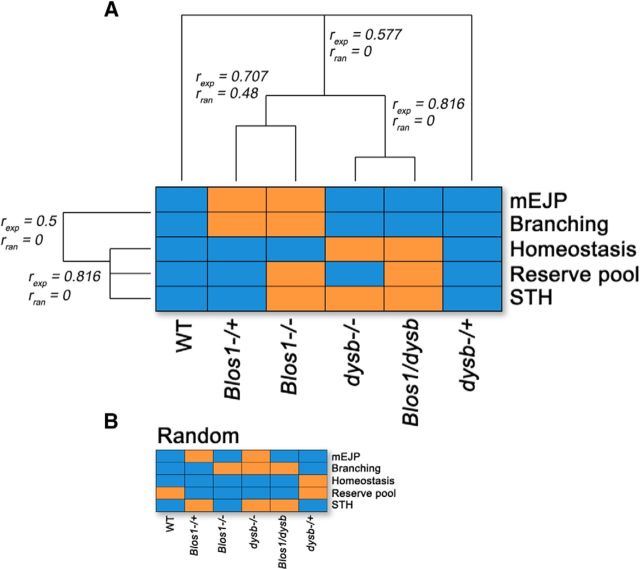
Figure 8.
Hierarchical clustering analysis of BLOC-1 genotype and their associated phenotypes. Genotype-to-phenotype pairs were analyzed by single linkage hierarchical clustering. Phenotypes are assigned a value of 0 to wild-type (blue) and 1 to mutant phenotypes (orange), respectively. A, Depicts experimentally generated genotype-to-phenotype pairs. B, Represents randomly assigned genotype-to-phenotype pairs. Hierarchical clustering analysis was performed for A and B and cluster r values are presented in A: r experimental (rexp) and r random (rran). All experimentally defined cluster r correlations are different from those predicted from random genotype-to-phenotype pairs. See text for details.

