
Figure 3.
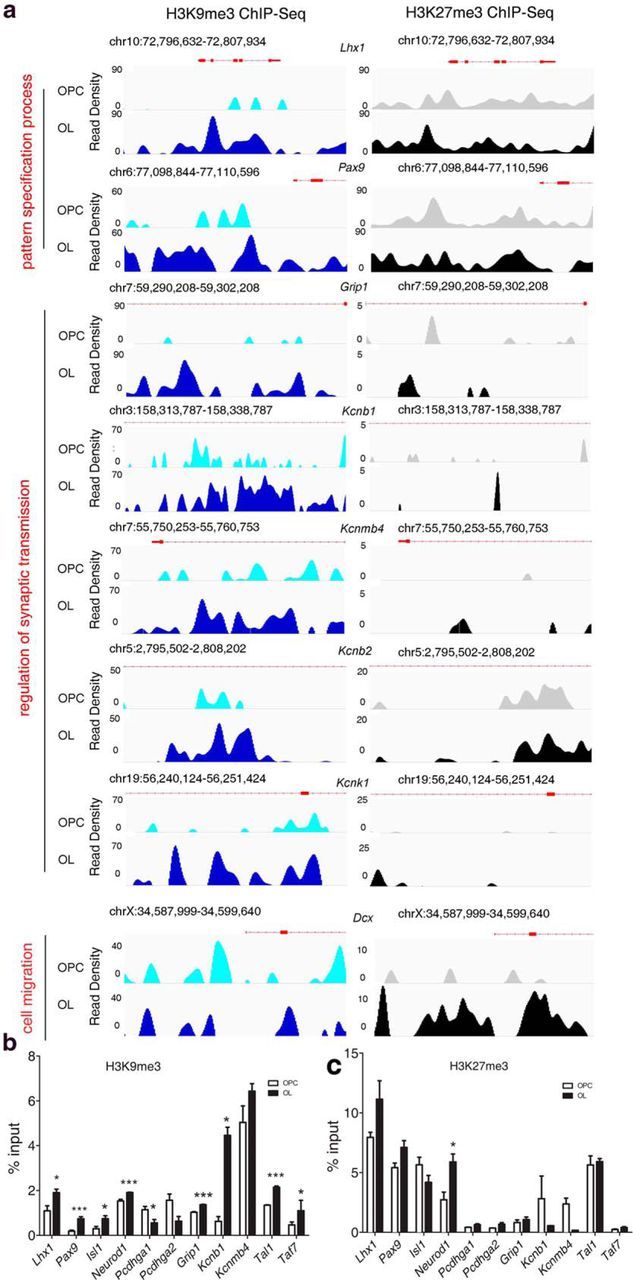
Visualization and validation of the ChIP-seq data. a, Visualization of the H3K9me3 and H3K27me3 ChIP-Seq data obtained from progenitors (OPCs) and differentiating OLs, using IGV, after input subtraction using previously described methods (Kharchenko et al., 2008). The genomic location for each gene is displayed above the peak density plots. The enriched peaks are shown by read density displayed on the y-axis. Thick red boxes on the Ref-seq genes represent exons. Thin lines indicate introns. The ontology term identified by DAVID analysis is shown on the left. Validation of the H3K9me3 (b) and H3K27me3 (c) ChIP-seq identified gene regions using chromatin isolated from progenitors and differentiating OLs. Bar graphs represent the relative enrichment for the repressive mark for each of the indicated genes. Data are mean ± SEM from three independent experiments. *p < 0.05 (unpaired t test). ***p < 0.001 (unpaired t test).