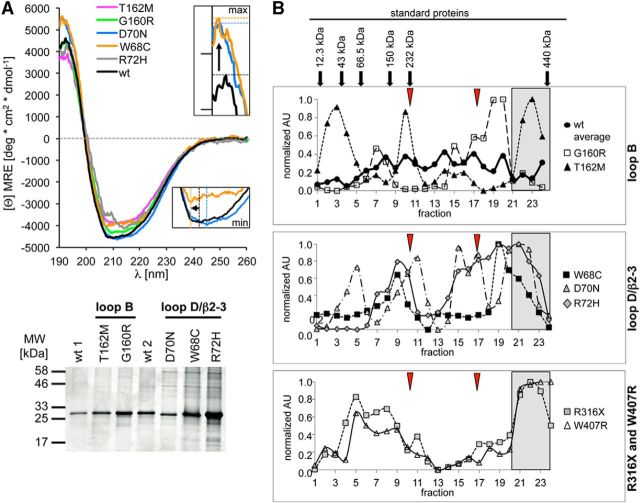
Figure 7.
Structural analysis of GlyRα1 variants. A, Circular dichroism spectroscopy of refolded GlyR ECDs of WT, loop B variants (G160R and T162M), and loop D/β2–3 variants. Colors are given in the figure legend next to the graph. Inset, Enlarged intensity maximum shown for W68C (orange) and D70N (light blue) compared with WT (black). Bottom, Coomassie-stained gel of the refolded WT and α1 ECD variants used for recording CD spectra. B, Sucrose density gradient centrifugation of the full-length GlyR WT and hyperekplexia variants. Peak distribution points to various receptor oligomerization states with monomers (left), over various assembly states to aggregates (far right) for loop B, D and TM3–4 loop variants. Arrows above the top graph point to the maximal peaks of the proteins used for calibration. Normalized AU, Arbitrary units determined from GlyR detection in various fractions using MAb4a. The line colors and symbols for each variant are given in the legends next to the graphs. The positions of the putative monomer and dimer obtained for Torpedo (Riganti et al., 2005) are marked by red arrowheads. Aggregrate formation is designated by gray boxes.

