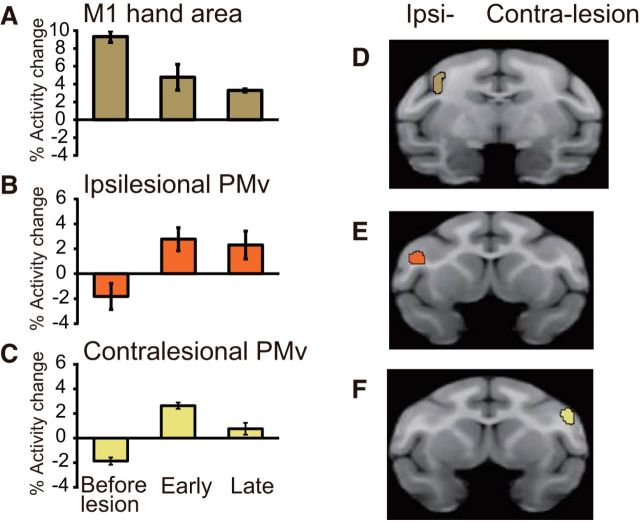
Figure 3.
A–C, Activation before the lesion and during the early and late postrecovery periods in the lesioned hand area of M1 (A), ipsilesional PMv (B), and contralesional PMv (C). Error bars indicate SD. D–F, The ROIs in the hand area of M1 (D), ipsilesional PMv (E), and contralesional PMv (F) used to calculate the bar graphs in A–C. ROIs of ipsilesional and contralesional PMv were defined as areas in which significantly increased activity was observed in the late postrecovery period (Z > 2.3). The cluster volumes were 45.1 mm3 in the ROI of M1 and 25.3 mm3 in the ROIs of ipsilesional and contralesional PMv, respectively.

