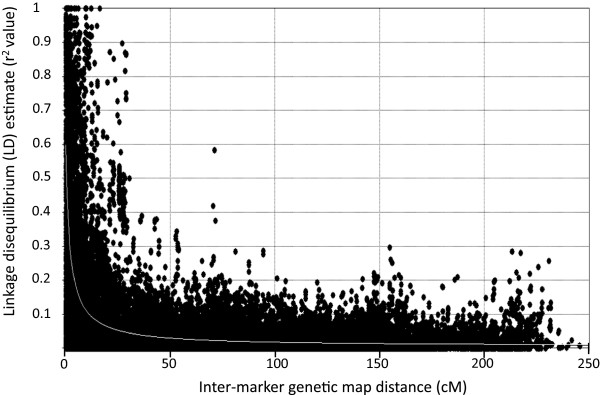
Figure 1.

Intra-chromosomal linkage disequilibrium (LD) decay plot as a function of genetic distance (cM). LD decay assessed in a durum wheat panel of 183 elite (cultivars and advanced lines) accessions adapted to the Mediterranean environments. LD estimates are reported as squared correlations of allele frequencies (r 2). Inter-marker genetic distances are from the durum wheat consensus map. Non-linear modeling of LD was performed using the Sved [39] equation.
