
Figure 5.
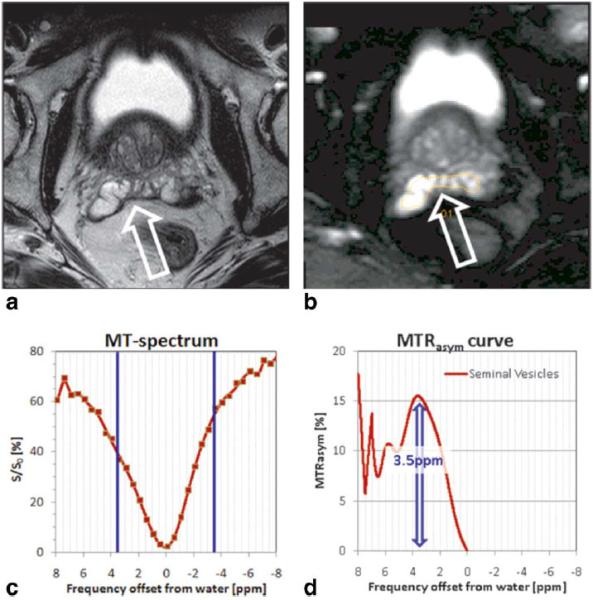
Seminal vesicles as shown in T2-weighted image (arrow) (a) and APT-MR image (b) exhibits asymmetric MTR at 3.5 ppm in magnetization transfer spectrum (c,d) with APTR of 15.1%. The MR imaging-detectable mobile protein levels in seminal vesicles are much higher than the mean APTR in prostate cancer. [Color figure can be viewed in the online issue, which is available at wileyonlinelibrary.com.]