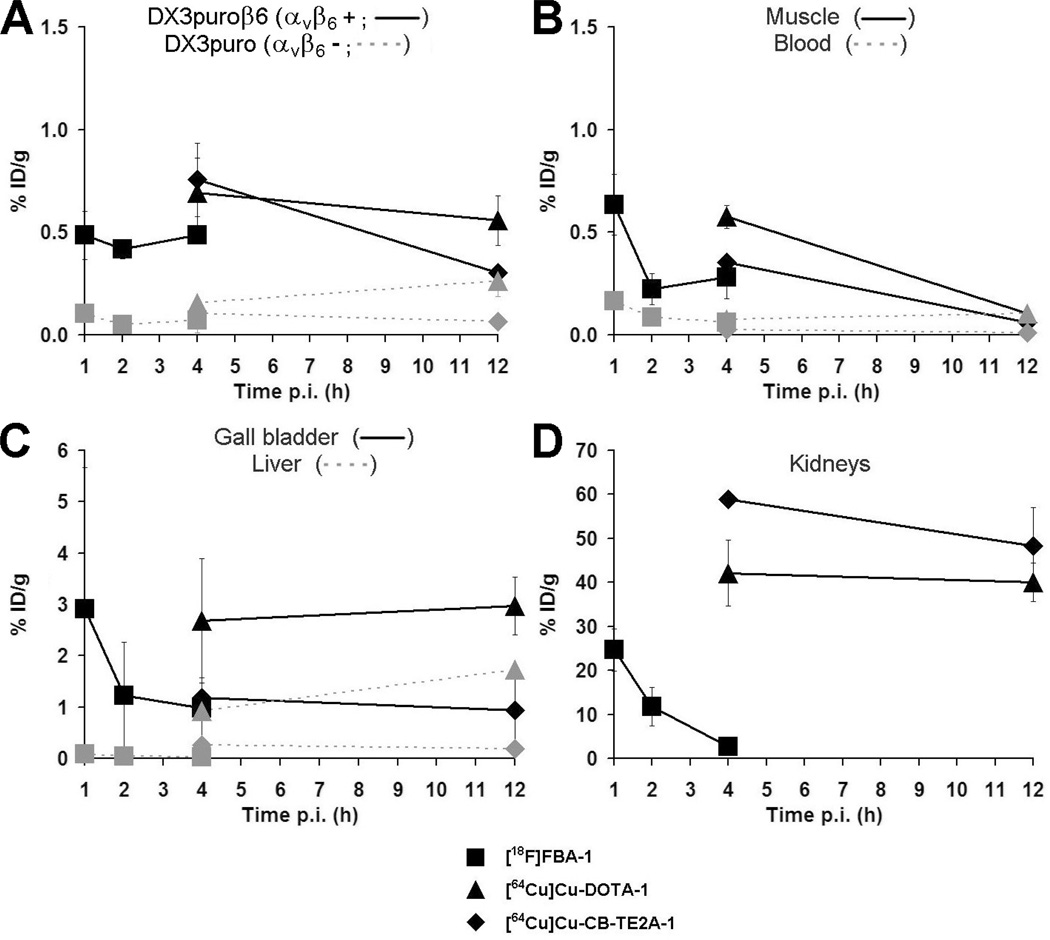
Figure 4.
Biodistribution data for tumors (A) and select organs (B: muscle, blood; C: gall bladder, liver; D: kidneys) obtained 1, 2, and 4 hours postinjection ([18F]FBA-1) or 4 and 12 hours postinjection ([64Cu]Cu-DOTA-1 and [64Cu]Cu-CB-TE2A-1) in the DX3puroβ6/DX3puro mouse model (n = 3/tracer per experiment per time point). Data are expressed as decay corrected % ID/g (points, % ID/g; bars, SD, smaller than the size of the symbol for some data points).

