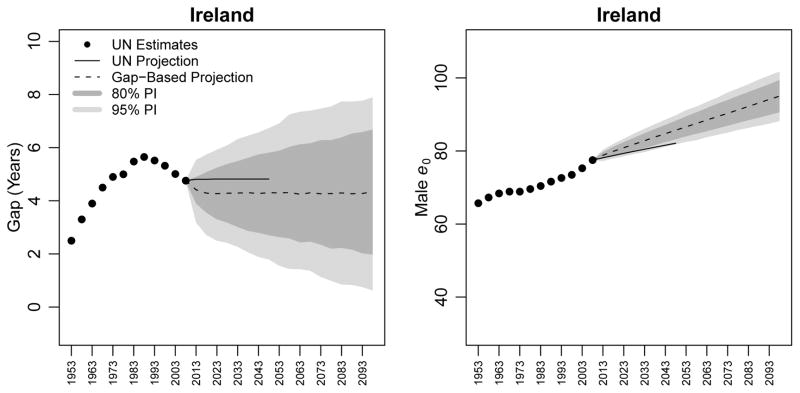
Figure 4.
Estimates and projections of the gap in life expectancy between females and males (left panel) and of male life expectancy (right panel) for Ireland. WPP 2008 estimates are shown as black circles; WPP 2008 projections to 2050 are shown as a black line. The median projection using our gap-based model is shown as a dotted line, along with its 80% and 95% predictive intervals (PIs).

