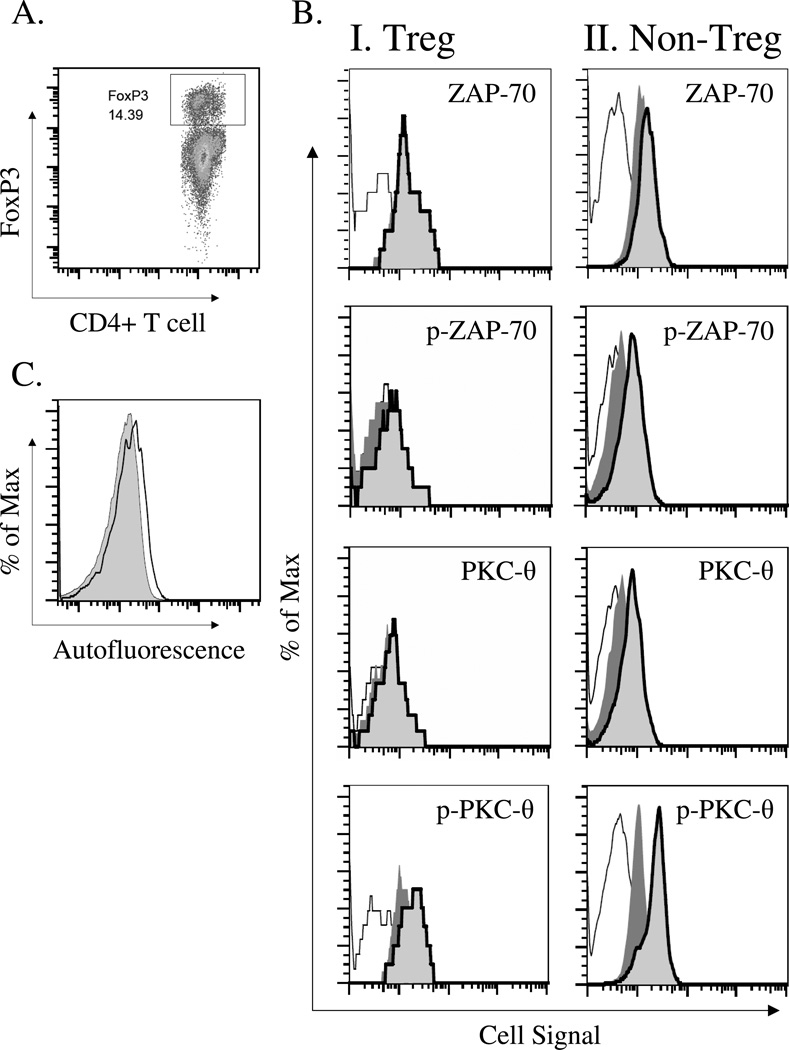
Figure 1. Analysis of intracellular signaling by phospho-flow cytometry in anti-CD3ε antibody stimulated FoxP3+CD4+ T cells (Tregs) and FoxP3−CD4+ T cells (non-Tregs).
The expression and phosphorylation of the intracellular signaling molecules, ZAP-70 and PKC-θ was assessed in splenic CD4+FoxP3+ T cells (Tregs) and CD4+FoxP3− T cells (non-Tregs) following stimulation with anti-CD3ε-specific antibody. Splenocytes were harvested from C57BL/6J mice. After 1 hour stimulation without or with 1 µg/ml anti-CD3ε mAb, cells were fixed with paraformaldehyde buffer and permeablized with ice-cold methanol. Cells were then stained with anti-CD4 and anti-FoxP3 antibody as well as antibodies specific for the un-phosphorylated or phosphorylated forms of ZAP-70 and PKC-θ. Stained cells were analyzed by flow cytometry. A) Gating strategy to identity CD4+FoxP3+ T cells (Tregs) in gated CD4+ T cells. B) Representative histograms displaying the expression/phosphorylation levels of ZAP-70/p-ZAP-70 and PKC-θ/p-PKC-θ in gated FoxP3+ CD4+ T cells (Tregs) and FoxP3− CD4+ T cells (non-Tregs) (negative control, solid line [=background]; stimulation with 0 µg/ml anti-CD3ε mAb, dark gray filling [constitutive expression / phosphorylation]; stimulation with 1 µg/ml anti-CD3ε mAb, solid bold line [induced expression / phosphorylation]. C) Differential autofluorescence between CD4+FoxP3+ T cells (Tregs) (solid line) and CD4+FoxP3− T cells (non-Tregs) (gray filling). For quantitative analysis of cell signaling in Tregs vs. non-Tregs, the RFI (relative fluorescence intensity) was therefore calculated (described in Material & Methods). This enabled us to directly compare signaling in Tregs vs. non-Tregs.

