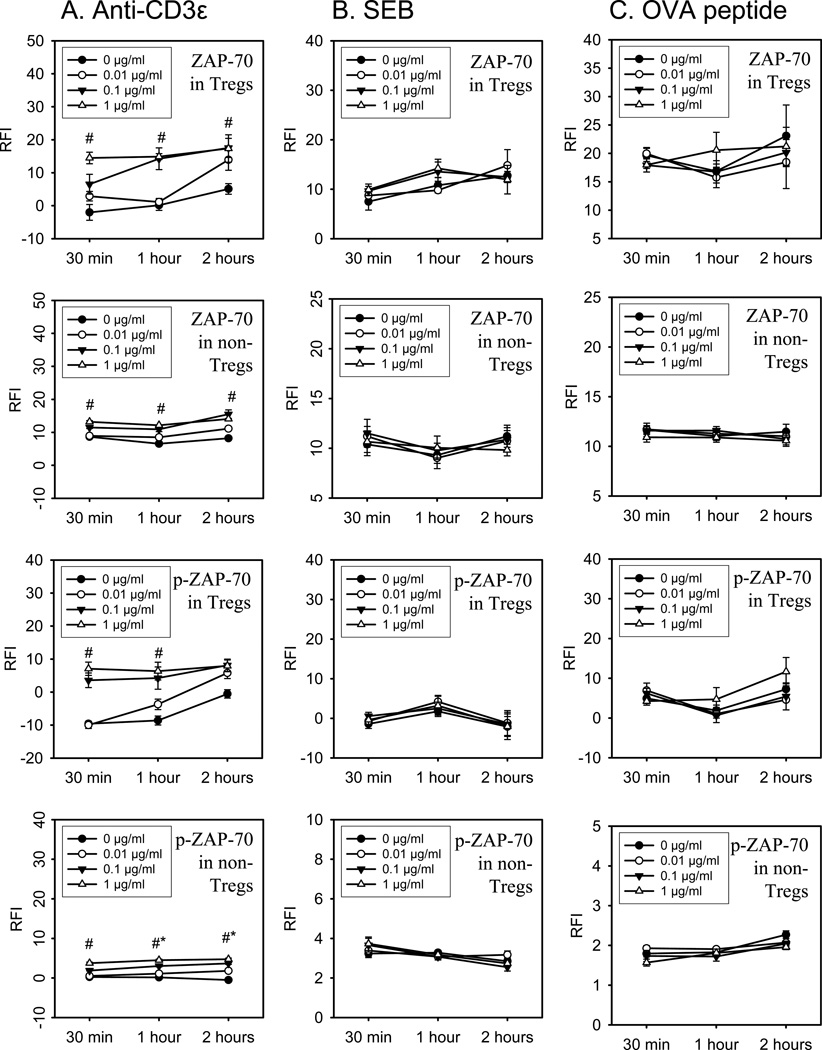
Figure 2. Expression and phosphorylation of ZAP-70 in Tregs and non-Tregs following in vitro stimulation with CD3ε mAb, SEB, and OVA.
Splenocytes from WT or OT-II transgenic mice were incubated with anti-CD3ε mAb (column A), SEB (column B), or OVA peptide (column C) at different doses (0, 0.01, 0.1, or 1 µg/ml). The differential expression of the intracellular signaling molecule ZAP-70 was assessed in Tregs and non-Tregs by flow cytometry and analyzed in a time dependent manner (30 min; 1 hour; and 2 hours). Intracellular phosphorylation of ZAP-70 was assessed using an antibody specific for the phosphorylated epitope, Tyr493, of ZAP-70 in Tregs and non-Tregs. The relative fluorescence intensity (RFI) for stained intracellular ZAP-70 and p-ZAP-70 in Tregs and non-Tregs is displayed. Data shown represents one of three independent experiments. N=3 individual mice per group. Mean ± SEM given, #p<0.05 1 µg/ml vs. 0 µg/ml stimulation, *p<0.05 vs. 30 min stimulation at 1 µg/ml.

