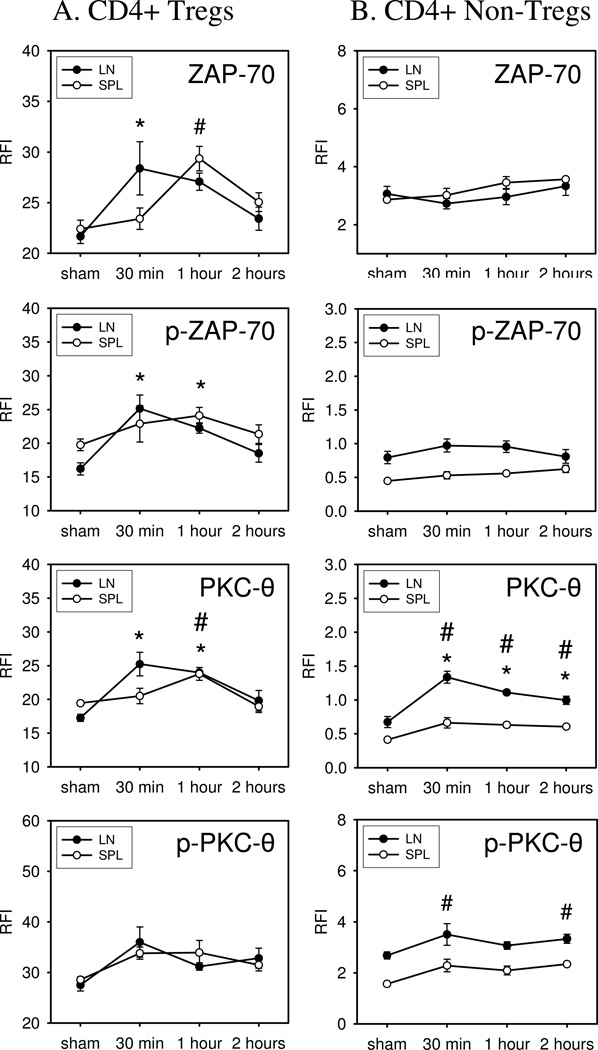
Figure 6. Expression and phosphorylation of PKC-θ and ZAP-70 in Tregs vs. non-Tregs following in vivo challenge of mice with SEB.
WT mice were challenged by i.p injection with 25µg/mouse SEB, dissolved in 250µl of PBS, or sham-treated by injection of PBS alone. After 30 min, 1 hour, or 2 hours treated mice were sacrificed and lymph nodes (LN) and spleens (SPL) were harvested to generate cell suspensions. The expression and phosphorylation of PKC-θ and ZAP-70 was assessed in Tregs and non-Tregs by flow cytometry. Data shown represent one of two independent experiments. N=3 mice. Mean ± SEM given, #p<0.05 vs. sham (SPL), *p<0.05 vs. sham (LN).

